
- Startseite >
- Flüsse >
- Schwebstoff >
- Untere Donau >
- Landshut Birket >
- Jahresgrafik

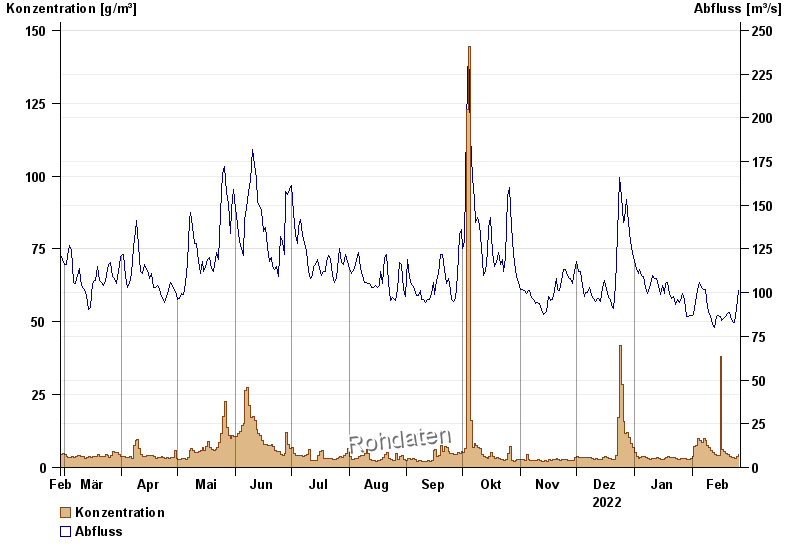
Jahresgrafik Landshut Birket / Isar
Schwebstoff vom 27.02.2022 bis zum 26.02.2023
| Datum | Konzentration [g/m³] | Abfluss [m³/s] |
|---|---|---|
| 26.02.2023 | 4,4 | 101 |
| 25.02.2023 | 3,6 | 91,2 |
| 24.02.2023 | 3,3 | 82,8 |
| 23.02.2023 | 3,5 | 82,7 |
| 22.02.2023 | 3,3 | 84,9 |
| 21.02.2023 | 3,8 | 88,9 |
| 20.02.2023 | 4,4 | 88 |
© Bayerisches Landesamt für Umwelt 2024