
- Startseite >
- Flüsse >
- Schwebstoff >
- Untere Donau >
- Landshut Birket >
- Jahresgrafik

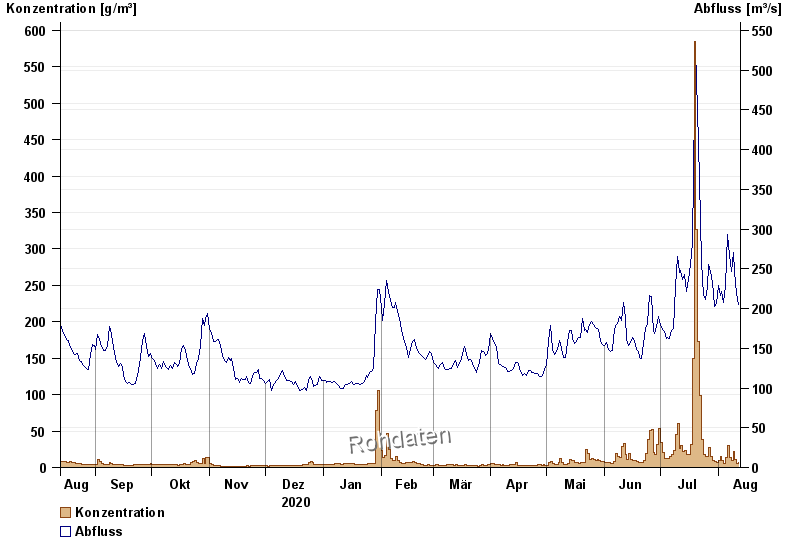
Jahresgrafik Landshut Birket / Isar
Schwebstoff vom 13.08.2020 bis zum 12.08.2021
| Datum | Konzentration [g/m³] | Abfluss [m³/s] |
|---|---|---|
| 12.08.2021 | 6,4 | 205 |
| 11.08.2021 | 6,1 | 219 |
| 10.08.2021 | 11,3 | 246 |
| 09.08.2021 | 21,9 | 271 |
| 08.08.2021 | 10,2 | 246 |
| 07.08.2021 | 14,0 | 267 |
| 06.08.2021 | 30,7 | 293 |
© Bayerisches Landesamt für Umwelt 2024