
- Startseite >
- Flüsse >
- Schwebstoff >
- Untere Donau >
- Landshut Birket >
- Jahresgrafik

Jahresgrafik Landshut Birket / Isar
Schwebstoff vom 12.10.2020 bis zum 11.10.2021
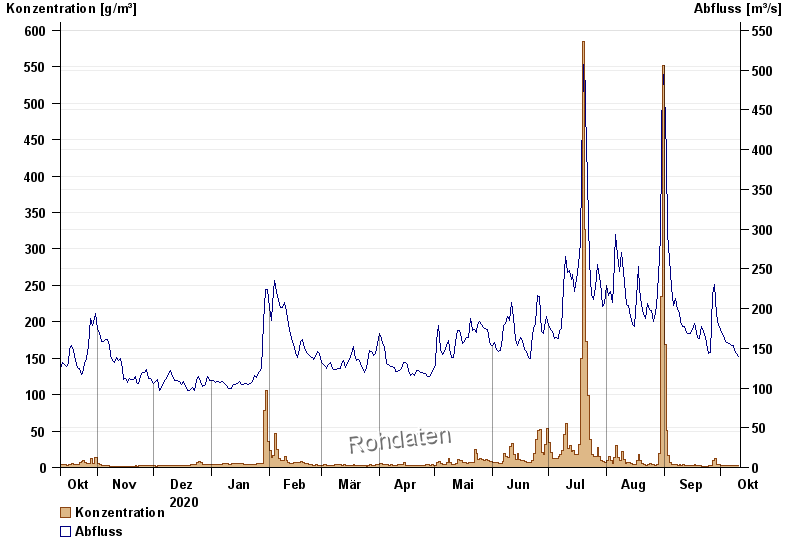
| Datum | Konzentration [g/m³] | Abfluss [m³/s] |
|---|---|---|
| 11.10.2021 | 2,6 | 140 |
| 10.10.2021 | 2,8 | 143 |
| 09.10.2021 | 3,0 | 147 |
| 08.10.2021 | 2,9 | 153 |
| 07.10.2021 | 2,5 | 154 |
| 06.10.2021 | 2,6 | 156 |
| 05.10.2021 | 2,7 | 157 |
© Bayerisches Landesamt für Umwelt 2024