
- Startseite >
- Flüsse >
- Schwebstoff >
- Untere Donau >
- Landshut Birket >
- Jahresgrafik

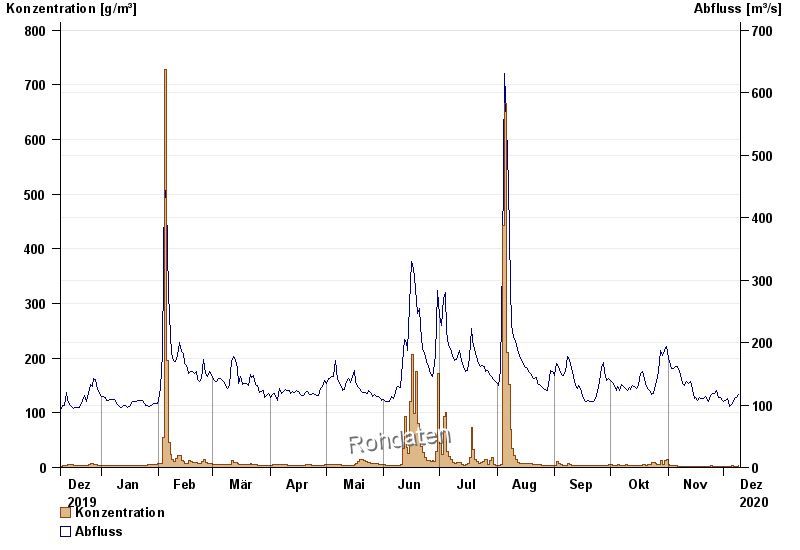
Jahresgrafik Landshut Birket / Isar
Schwebstoff vom 10.12.2019 bis zum 09.12.2020
| Datum | Konzentration [g/m³] | Abfluss [m³/s] |
|---|---|---|
| 09.12.2020 | 3,1 | 117 |
| 08.12.2020 | 2,5 | 112 |
| 07.12.2020 | 2,5 | 110 |
| 06.12.2020 | 2,6 | 106 |
| 05.12.2020 | 3,0 | 101 |
| 04.12.2020 | 2,2 | 97,1 |
| 03.12.2020 | 2,1 | 111 |
© Bayerisches Landesamt für Umwelt 2024