
- Startseite >
- Flüsse >
- Schwebstoff >
- Untere Donau >
- Landshut Birket >
- Jahresgrafik

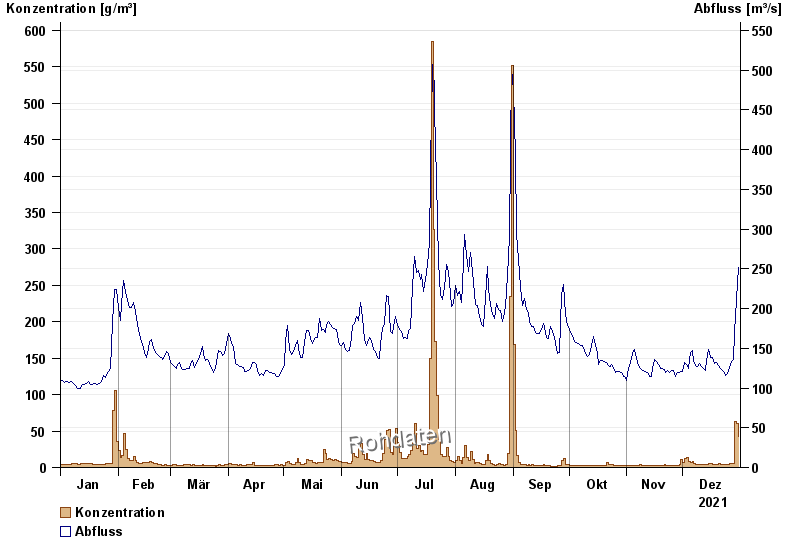
Jahresgrafik Landshut Birket / Isar
Schwebstoff vom 01.01.2021 bis zum 31.12.2021
| Datum | Konzentration [g/m³] | Abfluss [m³/s] |
|---|---|---|
| 31.12.2021 | 41,9 | 251 |
| 30.12.2021 | 60,8 | 211 |
| 29.12.2021 | 62,8 | 170 |
| 28.12.2021 | 5,1 | 136 |
| 27.12.2021 | 5,3 | 133 |
| 26.12.2021 | 5,4 | 126 |
| 25.12.2021 | 4,0 | 118 |
© Bayerisches Landesamt für Umwelt 2024