
- Startseite >
- Flüsse >
- Schwebstoff >
- Untere Donau >
- Kochel >
- Jahresgrafik

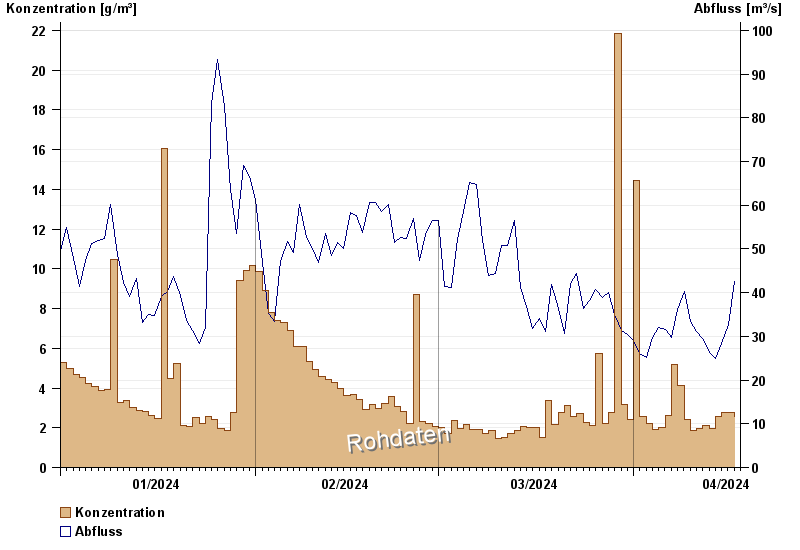
Jahresgrafik Kochel / Loisach
Schwebstoff vom 01.01.2024 bis zum 17.04.2024
| Datum | Konzentration [g/m³] | Abfluss [m³/s] |
|---|---|---|
| 17.04.2024 | 2,6 | 42,5 |
| 16.04.2024 | 2,8 | 32,6 |
| 15.04.2024 | 2,8 | 28,4 |
| 14.04.2024 | 2,6 | 24,9 |
| 13.04.2024 | 2,0 | 26,4 |
| 12.04.2024 | 2,1 | 29,5 |
| 11.04.2024 | 2,0 | 31 |
© Bayerisches Landesamt für Umwelt 2024