
- Startseite >
- Flüsse >
- Schwebstoff >
- Untere Donau >
- Kemmern >
- Jahresgrafik

Jahresgrafik Kemmern / Main
Schwebstoff vom 25.01.2020 bis zum 24.01.2021
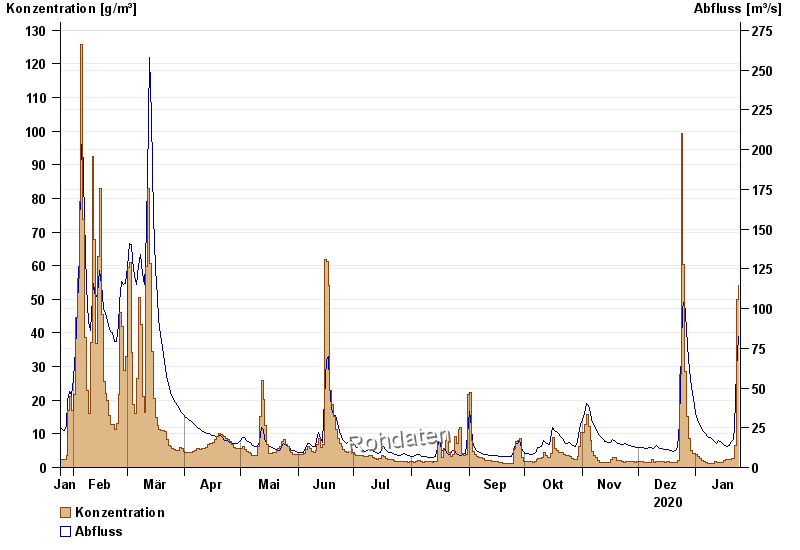
| Datum | Konzentration [g/m³] | Abfluss [m³/s] |
|---|---|---|
| 24.01.2021 | 54,3 | 82,3 |
| 23.01.2021 | 49,8 | 61,8 |
| 22.01.2021 | 6,6 | 25 |
| 21.01.2021 | 2,6 | 17,3 |
| 20.01.2021 | 2,5 | 16,3 |
| 19.01.2021 | 2,2 | 14 |
| 18.01.2021 | 2,3 | 13,4 |
© Bayerisches Landesamt für Umwelt 2024