
- Startseite >
- Flüsse >
- Schwebstoff >
- Untere Donau >
- Kemmern >
- Jahresgrafik

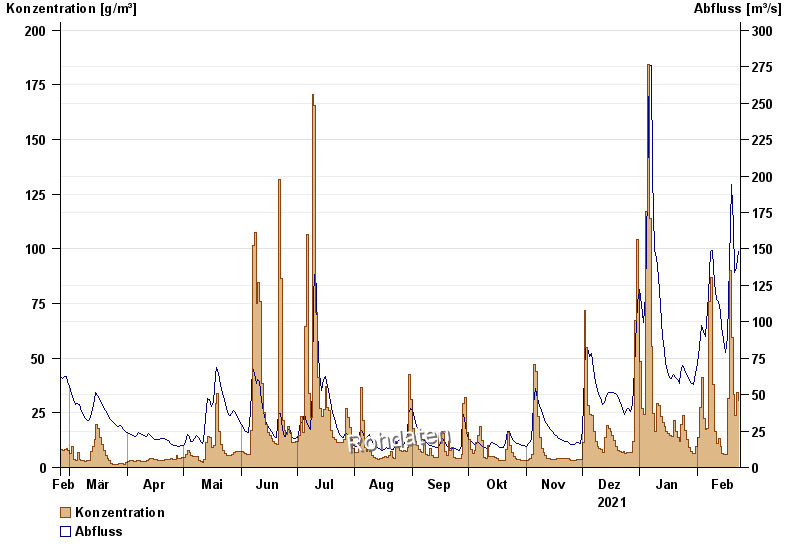
Jahresgrafik Kemmern / Main
Schwebstoff vom 24.02.2021 bis zum 23.02.2022
| Datum | Konzentration [g/m³] | Abfluss [m³/s] |
|---|---|---|
| 23.02.2022 | 30,6 | 148 |
| 22.02.2022 | 34,4 | 137 |
| 21.02.2022 | 24,0 | 134 |
| 20.02.2022 | 33,2 | 166 |
| 19.02.2022 | 59,4 | 194 |
| 18.02.2022 | 90,1 | 141 |
| 17.02.2022 | 31,6 | 89,3 |
© Bayerisches Landesamt für Umwelt 2024