
- Startseite >
- Flüsse >
- Schwebstoff >
- Untere Donau >
- Kemmern >
- Jahresgrafik

Jahresgrafik Kemmern / Main
Schwebstoff vom 24.02.2019 bis zum 23.02.2020
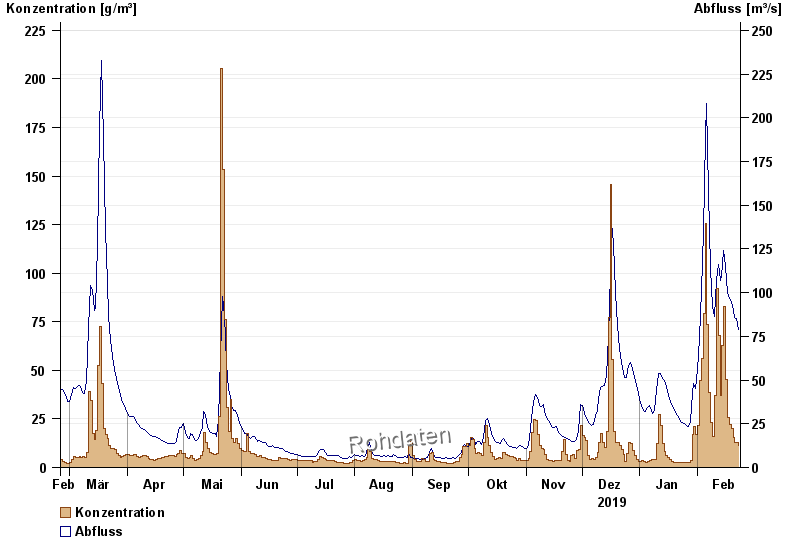
| Datum | Konzentration [g/m³] | Abfluss [m³/s] |
|---|---|---|
| 23.02.2020 | 11,3 | 79,1 |
| 22.02.2020 | 12,8 | 85,1 |
| 21.02.2020 | 12,9 | 85,6 |
| 20.02.2020 | 15,6 | 89,6 |
| 19.02.2020 | 20,1 | 95,2 |
| 18.02.2020 | 22,1 | 96,9 |
| 17.02.2020 | 25,7 | 100 |
© Bayerisches Landesamt für Umwelt 2024