
- Startseite >
- Flüsse >
- Schwebstoff >
- Untere Donau >
- Kemmern >
- Jahresgrafik

Jahresgrafik Kemmern / Main
Schwebstoff vom 18.04.2024 bis zum 17.04.2025
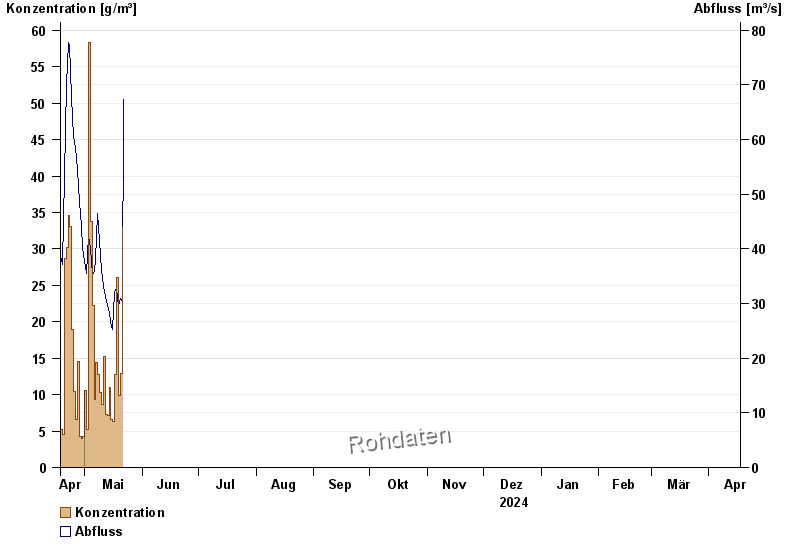
| Datum | Konzentration [g/m³] | Abfluss [m³/s] |
|---|---|---|
| 01.05.2024 | 10,6 | 37,7 |
| 30.04.2024 | 4,2 | 40,3 |
| 29.04.2024 | 4,0 | 44,1 |
| 28.04.2024 | 4,2 | 48,5 |
| 27.04.2024 | 14,6 | 54,5 |
| 26.04.2024 | 6,6 | 58,5 |
| 25.04.2024 | 10,4 | 60,6 |
© Bayerisches Landesamt für Umwelt 2024