
- Startseite >
- Flüsse >
- Schwebstoff >
- Untere Donau >
- Kemmern >
- Jahresgrafik

Jahresgrafik Kemmern / Main
Schwebstoff vom 10.12.2020 bis zum 09.12.2021
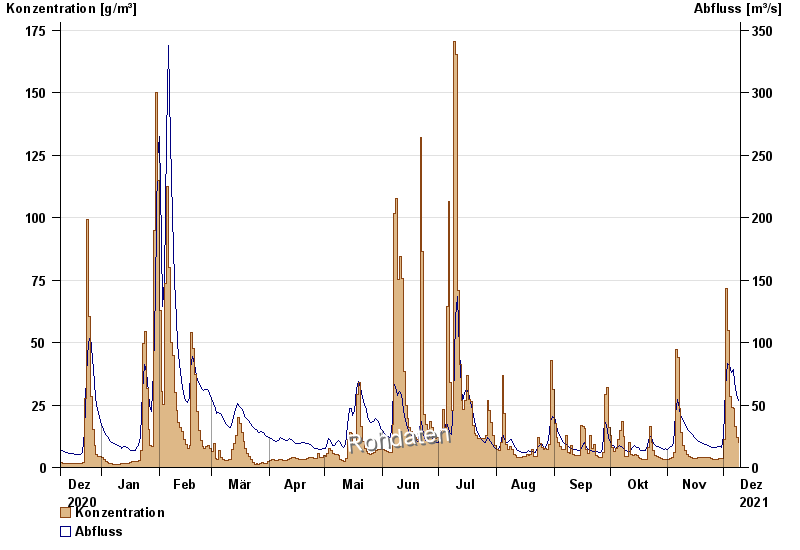
| Datum | Konzentration [g/m³] | Abfluss [m³/s] |
|---|---|---|
| 09.12.2021 | 9,8 | 53,3 |
| 08.12.2021 | 12,0 | 58,5 |
| 07.12.2021 | 16,4 | 68,1 |
| 06.12.2021 | 23,8 | 78,1 |
| 05.12.2021 | 24,2 | 76,4 |
| 04.12.2021 | 28,3 | 81,6 |
| 03.12.2021 | 54,8 | 82,9 |
© Bayerisches Landesamt für Umwelt 2024