
- Startseite >
- Flüsse >
- Schwebstoff >
- Untere Donau >
- Kemmern >
- Jahresgrafik

Jahresgrafik Kemmern / Main
Schwebstoff vom 10.12.2018 bis zum 09.12.2019
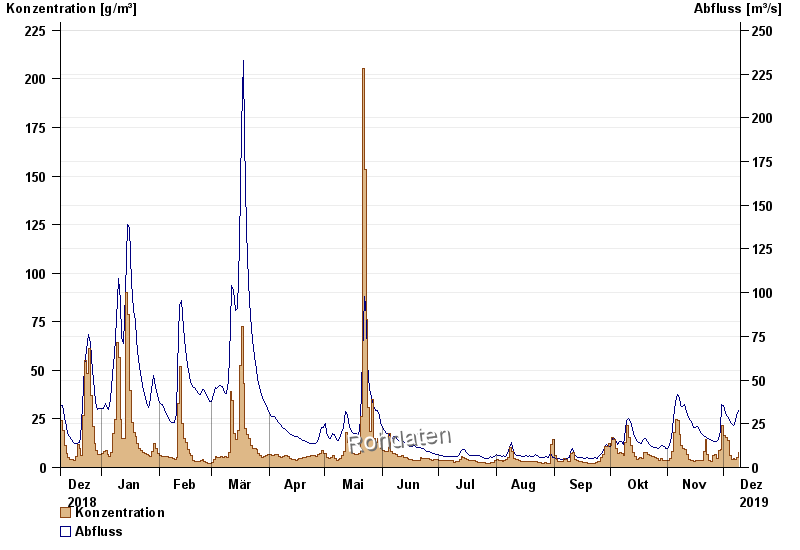
| Datum | Konzentration [g/m³] | Abfluss [m³/s] |
|---|---|---|
| 09.12.2019 | 7,6 | 32,4 |
| 08.12.2019 | 5,0 | 29,7 |
| 07.12.2019 | 4,3 | 24,7 |
| 06.12.2019 | 4,8 | 23,8 |
| 05.12.2019 | 4,0 | 25,4 |
| 04.12.2019 | 6,4 | 26,8 |
| 03.12.2019 | 13,9 | 28,9 |
© Bayerisches Landesamt für Umwelt 2024