
- Startseite >
- Flüsse >
- Schwebstoff >
- Untere Donau >
- Kemmern >
- Jahresgrafik

Jahresgrafik Kemmern / Main
Schwebstoff vom 01.01.2018 bis zum 31.12.2018
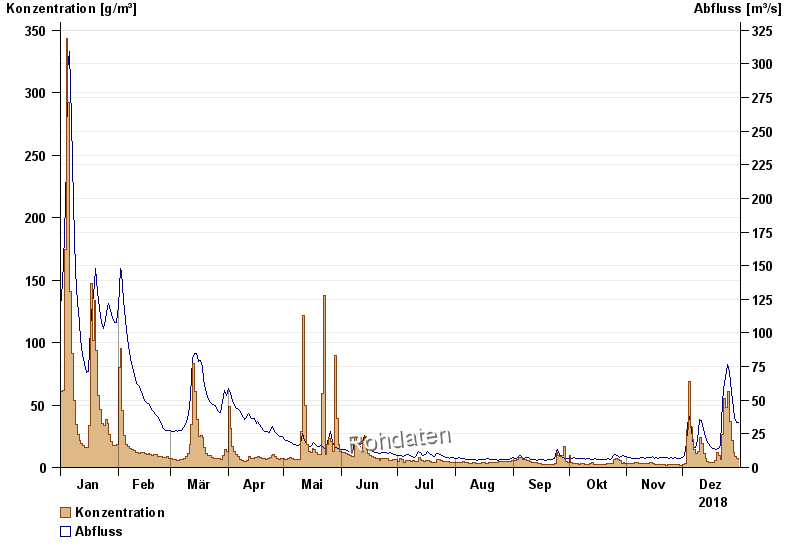
| Datum | Konzentration [g/m³] | Abfluss [m³/s] |
|---|---|---|
| 31.12.2018 | 6,7 | 33,6 |
| 30.12.2018 | 6,8 | 33,1 |
| 29.12.2018 | 8,8 | 36,9 |
| 28.12.2018 | 12,2 | 43,8 |
| 27.12.2018 | 21,3 | 55,5 |
| 26.12.2018 | 37,0 | 70,7 |
| 25.12.2018 | 61,2 | 76,3 |
© Bayerisches Landesamt für Umwelt 2024