
- Startseite >
- Flüsse >
- Schwebstoff >
- Untere Donau >
- Kalteneck >
- Jahresgrafik

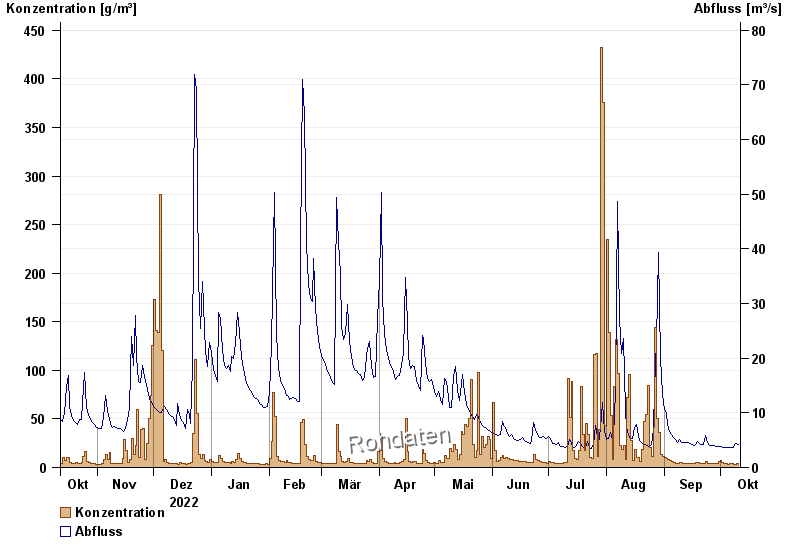
Jahresgrafik Kalteneck / Ilz
Schwebstoff vom 12.10.2022 bis zum 11.10.2023
| Datum | Konzentration [g/m³] | Abfluss [m³/s] |
|---|---|---|
| 11.10.2023 | 3,2 | 4,2 |
| 10.10.2023 | 4,0 | 4,48 |
| 09.10.2023 | 3,6 | 4,28 |
| 08.10.2023 | 3,2 | 3,66 |
| 07.10.2023 | 4,3 | 3,65 |
| 06.10.2023 | 3,7 | 3,67 |
| 05.10.2023 | 3,2 | 3,65 |
© Bayerisches Landesamt für Umwelt 2024