
- Startseite >
- Flüsse >
- Schwebstoff >
- Untere Donau >
- Kalteneck >
- Jahresgrafik

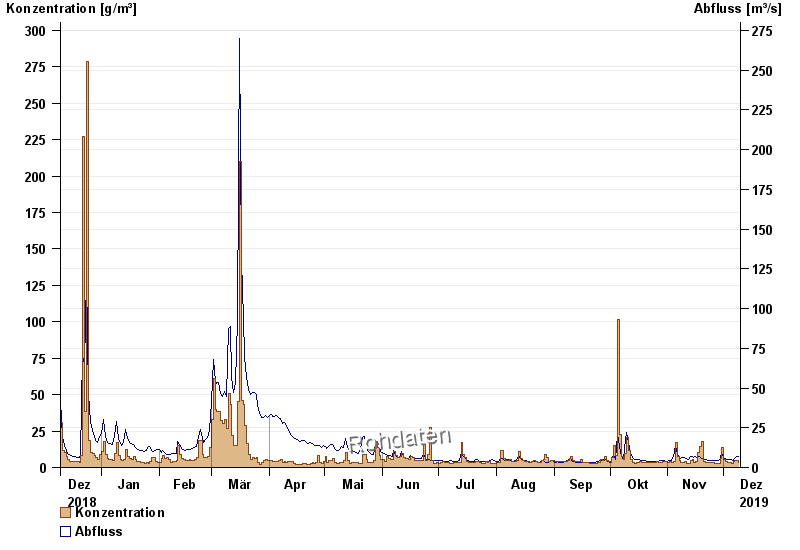
Jahresgrafik Kalteneck / Ilz
Schwebstoff vom 10.12.2018 bis zum 09.12.2019
| Datum | Konzentration [g/m³] | Abfluss [m³/s] |
|---|---|---|
| 09.12.2019 | 3,5 | 6,91 |
| 08.12.2019 | 4,6 | 6,63 |
| 07.12.2019 | 4,7 | 5,43 |
| 06.12.2019 | 4,1 | 4,54 |
| 05.12.2019 | 2,7 | 4,74 |
| 04.12.2019 | 3,2 | 4,9 |
| 03.12.2019 | 3,3 | 5,08 |
© Bayerisches Landesamt für Umwelt 2024