
- Startseite >
- Flüsse >
- Schwebstoff >
- Untere Donau >
- Kalteneck >
- Jahresgrafik

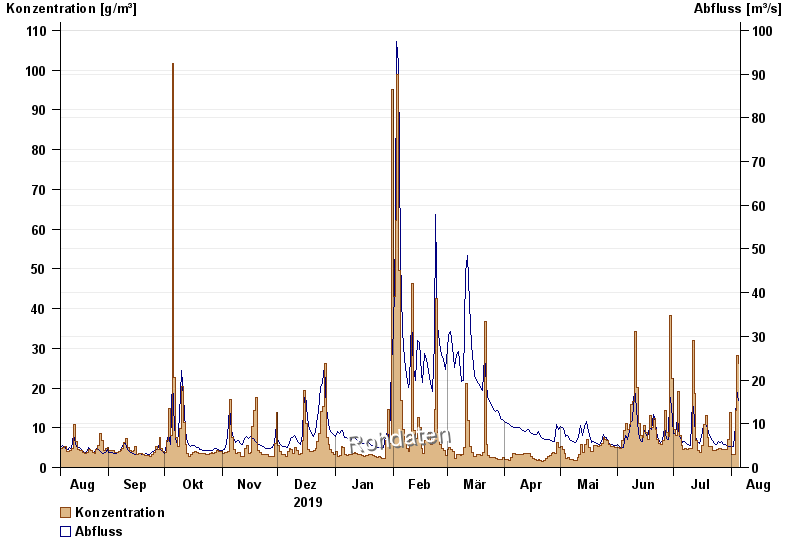
Jahresgrafik Kalteneck / Ilz
Schwebstoff vom 06.08.2019 bis zum 05.08.2020
| Datum | Konzentration [g/m³] | Abfluss [m³/s] |
|---|---|---|
| 05.08.2020 | 26,3 | 15,4 |
| 04.08.2020 | 28,2 | 17,8 |
| 03.08.2020 | 14,4 | 9,27 |
| 02.08.2020 | 3,2 | 4,73 |
| 01.08.2020 | 3,4 | 4,72 |
| 31.07.2020 | 13,8 | 4,88 |
| 30.07.2020 | 7,2 | 4,97 |
© Bayerisches Landesamt für Umwelt 2024