
- Startseite >
- Flüsse >
- Schwebstoff >
- Untere Donau >
- Ingolstadt Luitpoldstraße >
- Jahresgrafik

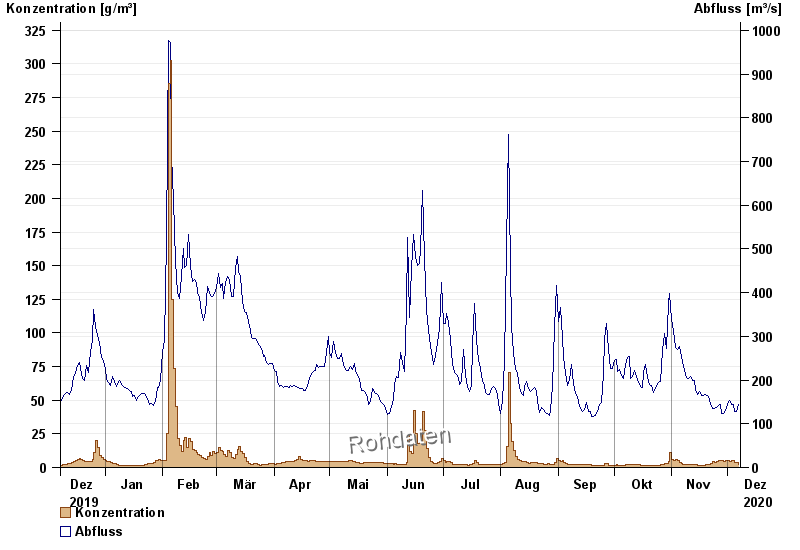
Jahresgrafik Ingolstadt Luitpoldstraße / Donau
Schwebstoff vom 08.12.2019 bis zum 07.12.2020
| Datum | Konzentration [g/m³] | Abfluss [m³/s] |
|---|---|---|
| 07.12.2020 | 2,6 | 144 |
| 06.12.2020 | 3,4 | 129 |
| 05.12.2020 | 4,1 | 128 |
| 04.12.2020 | 4,8 | 144 |
| 03.12.2020 | 5,0 | 145 |
| 02.12.2020 | 4,8 | 154 |
| 01.12.2020 | 5,3 | 145 |
© Bayerisches Landesamt für Umwelt 2024