
- Startseite >
- Flüsse >
- Schwebstoff >
- Untere Donau >
- Eschelbach >
- Monatsgrafik

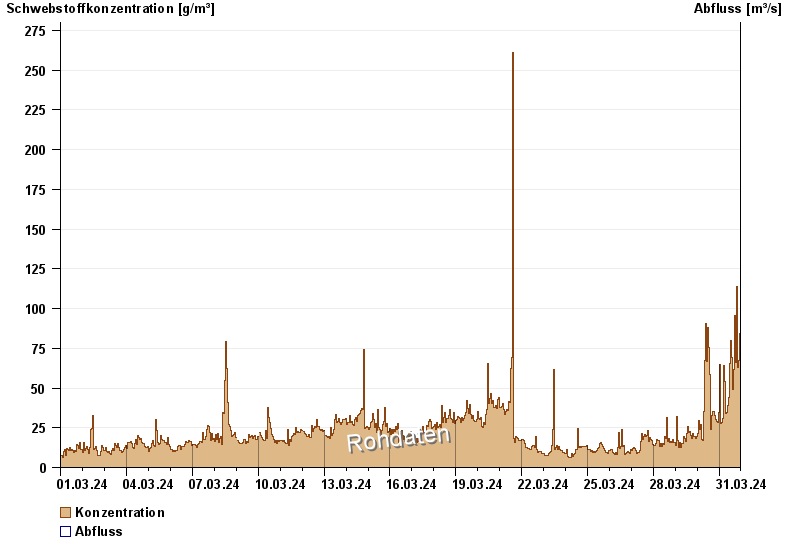
Monatsgrafik Eschelbach / Inn
Schwebstoff vom 01.03.2024 bis zum 31.03.2024
| Datum | Konzentration [g/m³] | Abfluss [m³/s] |
|---|---|---|
| 31.03.2024 23:45 | 44,7 | -- |
| 31.03.2024 23:30 | 35,1 | -- |
| 31.03.2024 23:15 | 34,1 | -- |
| 31.03.2024 23:00 | 38,4 | -- |
| 31.03.2024 22:45 | 55,5 | -- |
| 31.03.2024 22:30 | 35,6 | -- |
| 31.03.2024 22:15 | 47,7 | -- |
© Bayerisches Landesamt für Umwelt 2024