
- Startseite >
- Flüsse >
- Schwebstoff >
- Untere Donau >
- Donauwörth >
- Monatsgrafik

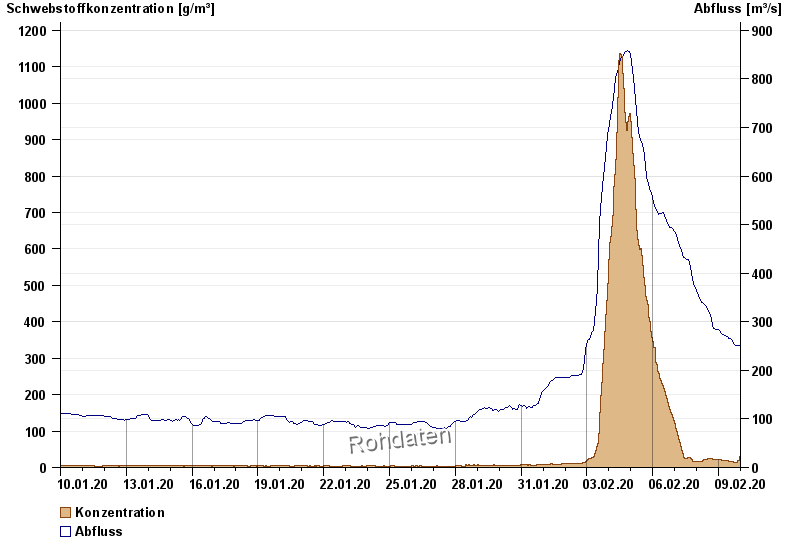
Monatsgrafik Donauwörth / Donau
Schwebstoff vom 10.01.2020 bis zum 09.02.2020
| Datum | Konzentration [g/m³] | Abfluss [m³/s] |
|---|---|---|
| 09.02.2020 23:45 | 38,9 | 253 |
| 09.02.2020 23:30 | 35,3 | 252 |
| 09.02.2020 23:15 | 25,9 | 252 |
| 09.02.2020 23:00 | 29,4 | 252 |
| 09.02.2020 22:45 | 23,6 | 252 |
| 09.02.2020 22:30 | 31,5 | 252 |
| 09.02.2020 22:15 | 17,9 | 252 |
© Bayerisches Landesamt für Umwelt 2024