
- Startseite >
- Flüsse >
- Schwebstoff >
- Untere Donau >
- Donauwörth >
- Jahresgrafik

Jahresgrafik Donauwörth / Donau
Schwebstoff vom 28.03.2024 bis zum 27.03.2025
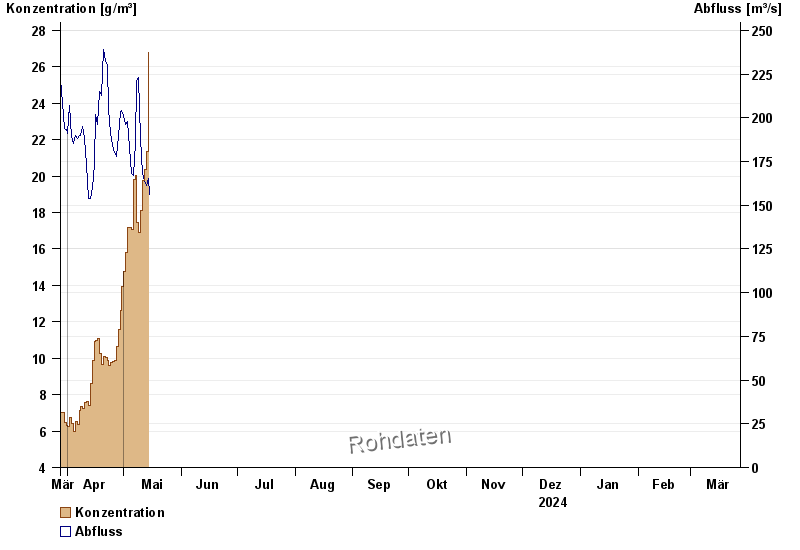
| Datum | Konzentration [g/m³] | Abfluss [m³/s] |
|---|---|---|
| 28.04.2024 | 11,6 | 189 |
| 27.04.2024 | 10,7 | 178 |
| 26.04.2024 | 9,9 | 180 |
| 25.04.2024 | 9,8 | 184 |
| 24.04.2024 | 9,8 | 191 |
| 23.04.2024 | 9,6 | 205 |
| 22.04.2024 | 9,9 | 230 |
© Bayerisches Landesamt für Umwelt 2024