
- Startseite >
- Flüsse >
- Schwebstoff >
- Untere Donau >
- Donauwörth >
- Jahresgrafik

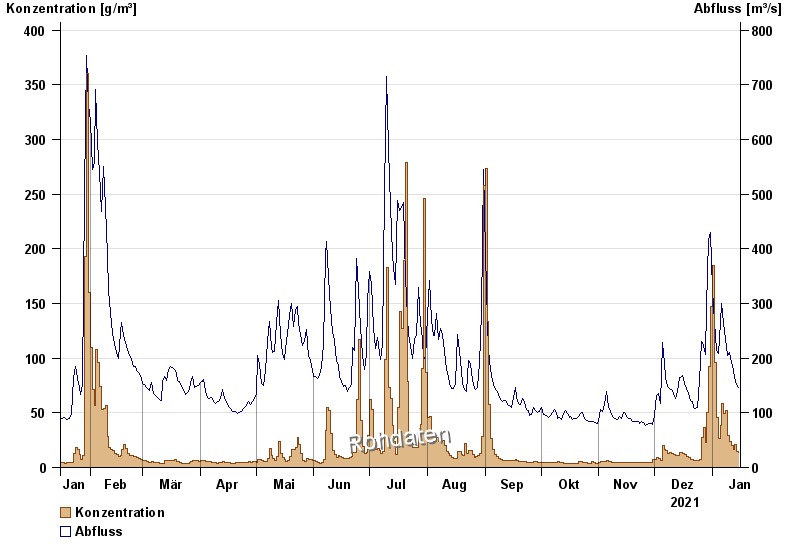
Jahresgrafik Donauwörth / Donau
Schwebstoff vom 16.01.2021 bis zum 15.01.2022
| Datum | Konzentration [g/m³] | Abfluss [m³/s] |
|---|---|---|
| 15.01.2022 | 13,3 | 146 |
| 14.01.2022 | 14,9 | 151 |
| 13.01.2022 | 21,4 | 165 |
| 12.01.2022 | 16,6 | 178 |
| 11.01.2022 | 20,0 | 192 |
| 10.01.2022 | 23,9 | 210 |
| 09.01.2022 | 29,4 | 205 |
© Bayerisches Landesamt für Umwelt 2024