
- Startseite >
- Flüsse >
- Schwebstoff >
- Untere Donau >
- Donauwörth >
- Jahresgrafik

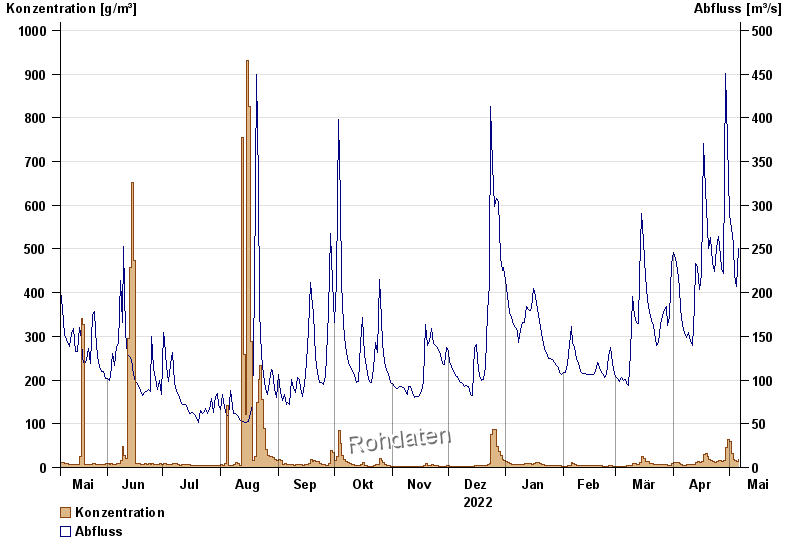
Jahresgrafik Donauwörth / Donau
Schwebstoff vom 07.05.2022 bis zum 06.05.2023
| Datum | Konzentration [g/m³] | Abfluss [m³/s] |
|---|---|---|
| 06.05.2023 | 18,8 | 251 |
| 05.05.2023 | 13,0 | 207 |
| 04.05.2023 | 15,2 | 220 |
| 03.05.2023 | 19,4 | 255 |
| 02.05.2023 | 32,2 | 273 |
| 01.05.2023 | 58,5 | 289 |
| 30.04.2023 | 64,1 | 373 |
© Bayerisches Landesamt für Umwelt 2024