
- Startseite >
- Flüsse >
- Schwebstoff >
- Untere Donau >
- Bad Tölz Brücke >
- Jahresgrafik

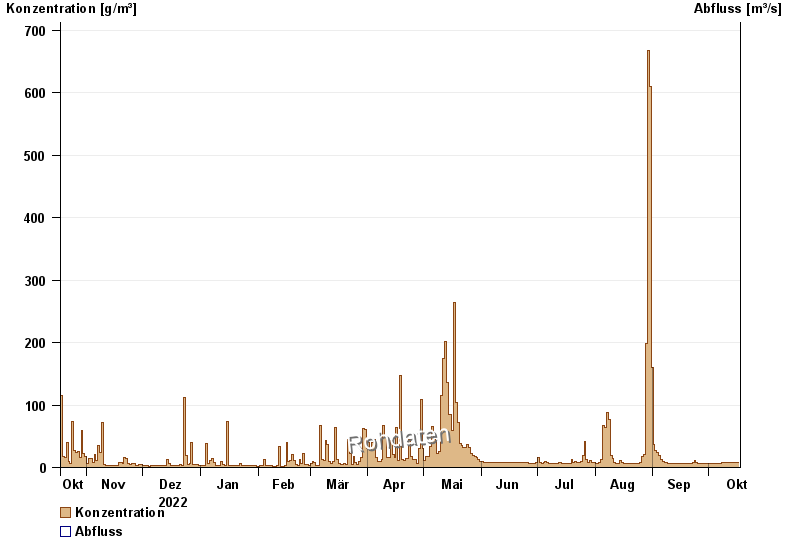
Jahresgrafik Bad Tölz Brücke / Isar
Schwebstoff vom 18.10.2022 bis zum 17.10.2023
| Datum | Konzentration [g/m³] | Abfluss [m³/s] |
|---|---|---|
| 17.10.2023 | 8,2 | -- |
| 16.10.2023 | 8,0 | -- |
| 15.10.2023 | 7,9 | -- |
| 14.10.2023 | 8,2 | -- |
| 13.10.2023 | 8,1 | -- |
| 12.10.2023 | 8,1 | -- |
| 11.10.2023 | 8,1 | -- |
© Bayerisches Landesamt für Umwelt 2024