
- Startseite >
- Flüsse >
- Schwebstoff >
- Naab - Regen >
- Schlehdorf >
- Jahresgrafik

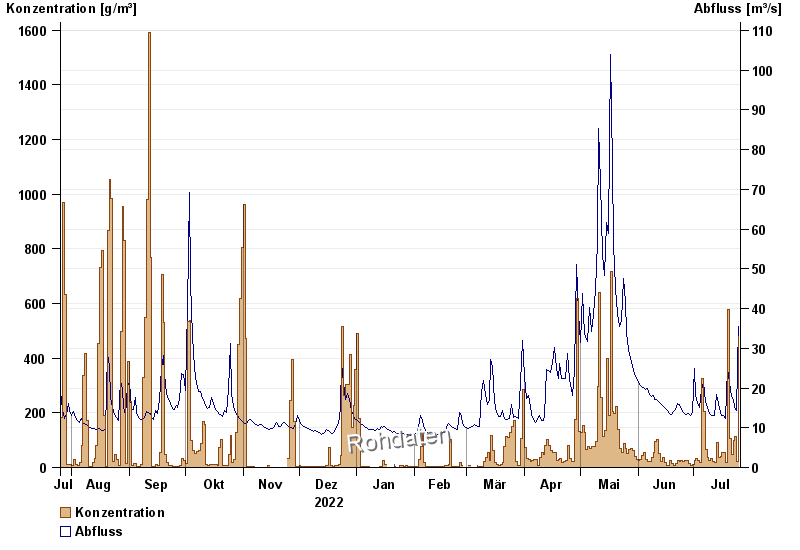
Jahresgrafik Schlehdorf / Loisach
Schwebstoff vom 26.07.2022 bis zum 25.07.2023
| Datum | Konzentration [g/m³] | Abfluss [m³/s] |
|---|---|---|
| 25.07.2023 | 480,8 | 35,4 |
| 24.07.2023 | 20,9 | 14,4 |
| 23.07.2023 | 113,1 | 15,1 |
| 22.07.2023 | 98,1 | 17,2 |
| 21.07.2023 | 48,8 | 17,9 |
| 20.07.2023 | 106,1 | 21,4 |
| 19.07.2023 | 577,3 | 24,8 |
© Bayerisches Landesamt für Umwelt 2024