
- Startseite >
- Flüsse >
- Schwebstoff >
- Naab - Regen >
- Schlehdorf >
- Jahresgrafik

Jahresgrafik Schlehdorf / Loisach
Schwebstoff vom 26.07.2020 bis zum 25.07.2021
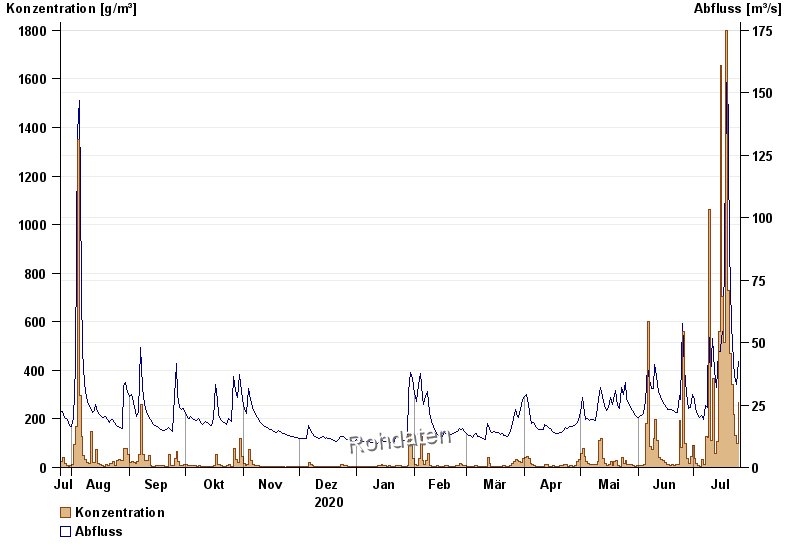
| Datum | Konzentration [g/m³] | Abfluss [m³/s] |
|---|---|---|
| 25.07.2021 | 269,5 | 42,3 |
| 24.07.2021 | 98,2 | 33,4 |
| 23.07.2021 | 131,3 | 36,4 |
| 22.07.2021 | 217,8 | 42,5 |
| 21.07.2021 | 343,5 | 57,3 |
| 20.07.2021 | 468,0 | 87,7 |
| 19.07.2021 | 727,0 | 165 |
© Bayerisches Landesamt für Umwelt 2024