
- Startseite >
- Flüsse >
- Schwebstoff >
- Naab - Regen >
- Plattling >
- Monatsgrafik

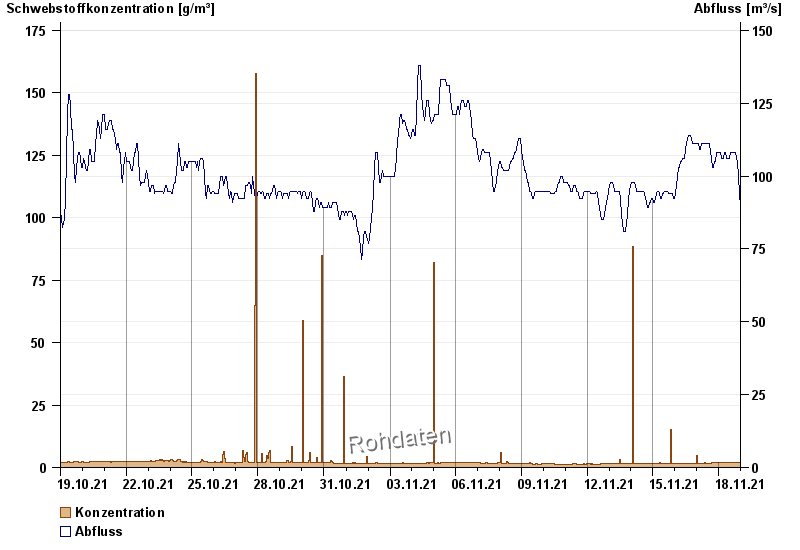
Monatsgrafik Plattling / Isar
Schwebstoff vom 19.10.2021 bis zum 18.11.2021
| Datum | Konzentration [g/m³] | Abfluss [m³/s] |
|---|---|---|
| 18.11.2021 23:45 | 2,1 | 86,4 |
| 18.11.2021 23:30 | 2,1 | 89,3 |
| 18.11.2021 23:15 | 2,1 | 90,9 |
| 18.11.2021 23:00 | 2,1 | 92,3 |
| 18.11.2021 22:45 | 2,1 | 94 |
| 18.11.2021 22:30 | 2,1 | 94 |
| 18.11.2021 22:15 | 2,1 | 94,8 |
© Bayerisches Landesamt für Umwelt 2024