
- Startseite >
- Flüsse >
- Schwebstoff >
- Naab - Regen >
- Plattling >
- Jahresgrafik

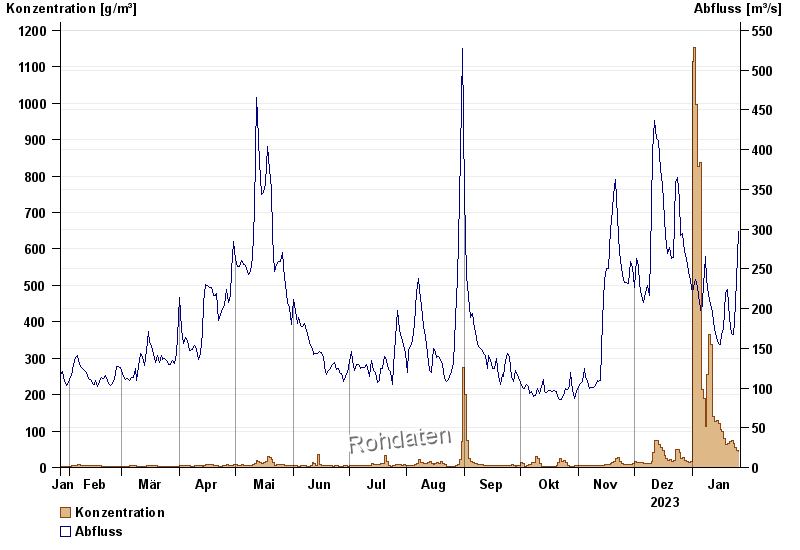
Jahresgrafik Plattling / Isar
Schwebstoff vom 27.01.2023 bis zum 26.01.2024
| Datum | Konzentration [g/m³] | Abfluss [m³/s] |
|---|---|---|
| 26.01.2024 | 43,8 | 297 |
| 25.01.2024 | 47,5 | 235 |
| 24.01.2024 | 53,9 | 182 |
| 23.01.2024 | 66,2 | 167 |
| 22.01.2024 | 75,1 | 168 |
| 21.01.2024 | 72,6 | 188 |
| 20.01.2024 | 65,9 | 224 |
© Bayerisches Landesamt für Umwelt 2024