
- Startseite >
- Flüsse >
- Schwebstoff >
- Naab - Regen >
- Donauwörth >
- Jahresgrafik

Jahresgrafik Donauwörth / Donau
Schwebstoff vom 28.09.2020 bis zum 27.09.2021
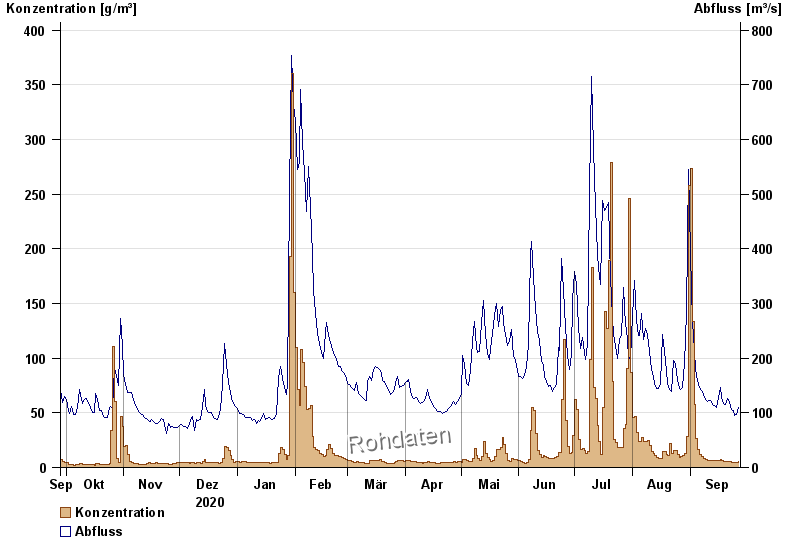
| Datum | Konzentration [g/m³] | Abfluss [m³/s] |
|---|---|---|
| 27.09.2021 | 5,2 | 109 |
| 26.09.2021 | 4,6 | 96,8 |
| 25.09.2021 | 4,4 | 94,8 |
| 24.09.2021 | 4,5 | 104 |
| 23.09.2021 | 4,9 | 107 |
| 22.09.2021 | 5,4 | 119 |
| 21.09.2021 | 5,6 | 127 |
© Bayerisches Landesamt für Umwelt 2024