
- Startseite >
- Flüsse >
- Schwebstoff >
- Naab - Regen >
- Donauwörth >
- Jahresgrafik

Jahresgrafik Donauwörth / Donau
Schwebstoff vom 27.01.2020 bis zum 26.01.2021
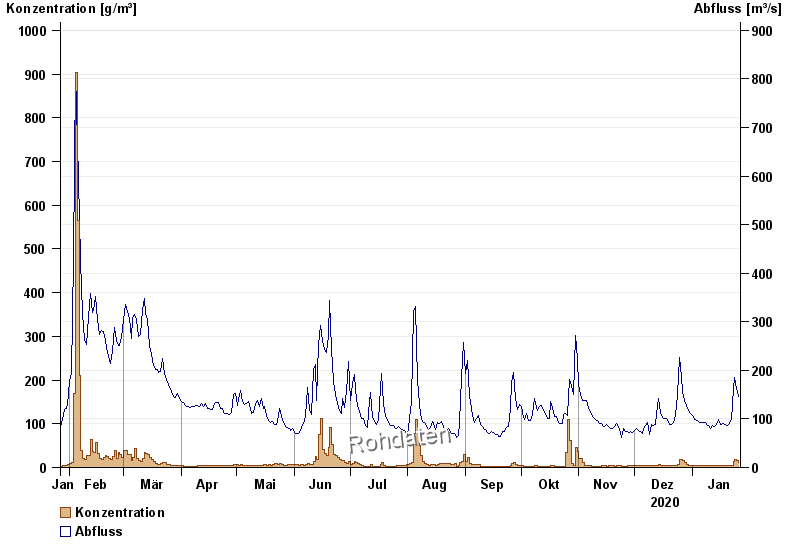
| Datum | Konzentration [g/m³] | Abfluss [m³/s] |
|---|---|---|
| 26.01.2021 | 11,9 | 146 |
| 25.01.2021 | 16,7 | 163 |
| 24.01.2021 | 18,0 | 185 |
| 23.01.2021 | 12,7 | 163 |
| 22.01.2021 | 4,6 | 98,4 |
| 21.01.2021 | 4,5 | 90,4 |
| 20.01.2021 | 4,6 | 87,2 |
© Bayerisches Landesamt für Umwelt 2024