
- Startseite >
- Flüsse >
- Schwebstoff >
- Unterer Main >
- Unterjettenberg >
- Jahresgrafik

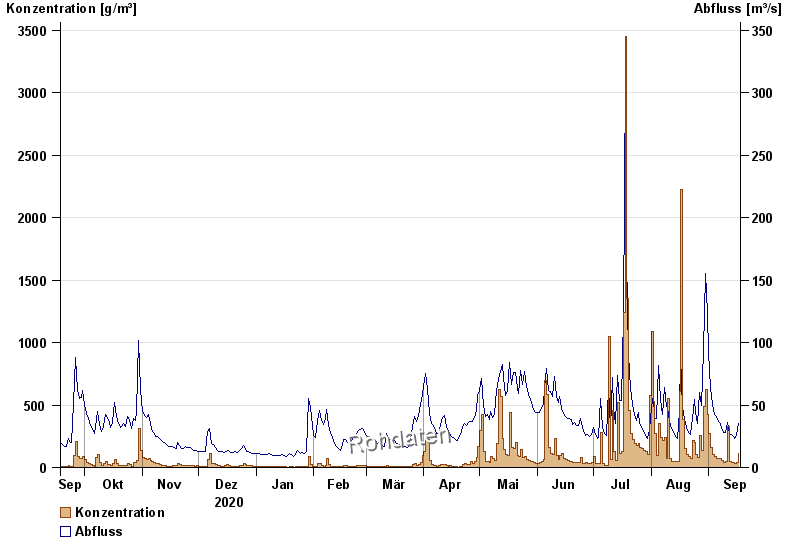
Jahresgrafik Unterjettenberg / Saalach
Schwebstoff vom 18.09.2020 bis zum 17.09.2021
| Datum | Konzentration [g/m³] | Abfluss [m³/s] |
|---|---|---|
| 17.09.2021 | 113,1 | 34,9 |
| 16.09.2021 | 39,2 | 25,7 |
| 15.09.2021 | 33,8 | 23,6 |
| 14.09.2021 | 39,6 | 25,1 |
| 13.09.2021 | 44,0 | 26,7 |
| 12.09.2021 | 50,8 | 26,9 |
| 11.09.2021 | 328,7 | 36,3 |
© Bayerisches Landesamt für Umwelt 2024