
- Startseite >
- Flüsse >
- Schwebstoff >
- Unterer Main >
- Schönach >
- Jahresgrafik

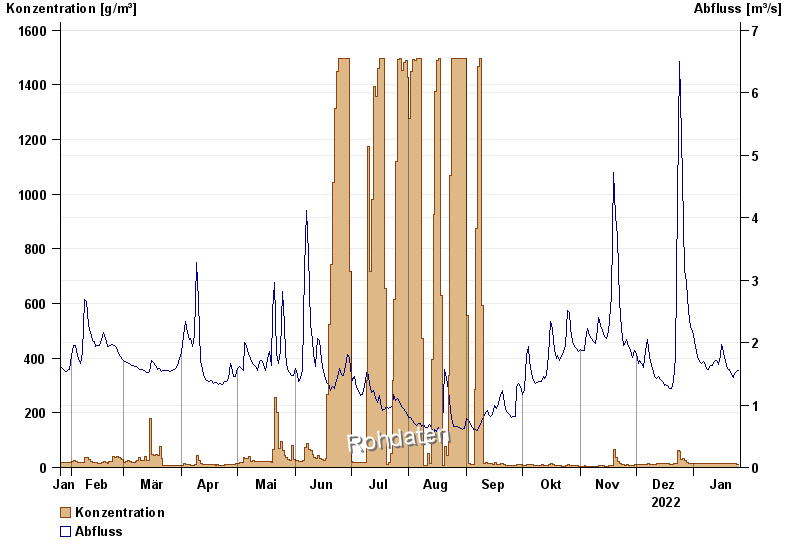
Jahresgrafik Schönach / Große Laber
Schwebstoff vom 26.01.2022 bis zum 25.01.2023
| Datum | Konzentration [g/m³] | Abfluss [m³/s] |
|---|---|---|
| 25.01.2023 | 12,4 | 1,55 |
| 24.01.2023 | 12,4 | 1,54 |
| 23.01.2023 | 13,0 | 1,51 |
| 22.01.2023 | 13,3 | 1,44 |
| 21.01.2023 | 13,4 | 1,49 |
| 20.01.2023 | 13,7 | 1,57 |
| 19.01.2023 | 13,4 | 1,59 |
© Bayerisches Landesamt für Umwelt 2024