
- Startseite >
- Flüsse >
- Schwebstoff >
- Unterer Main >
- Schönach >
- Jahresgrafik

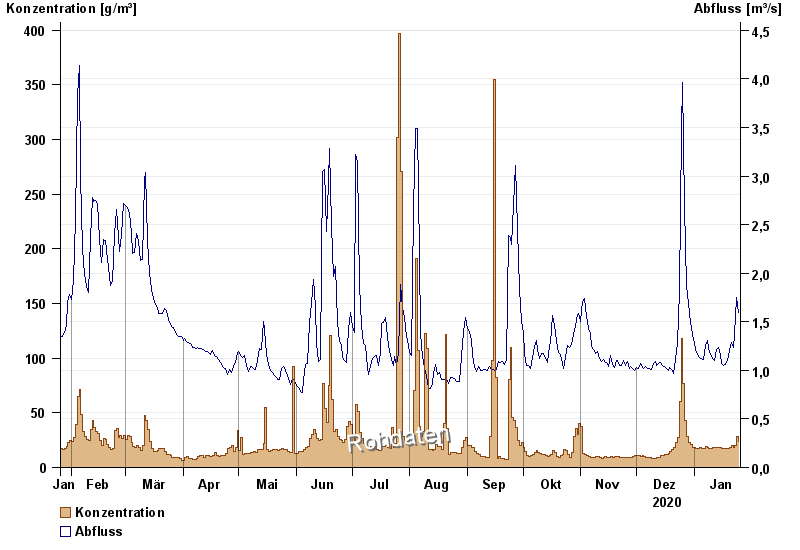
Jahresgrafik Schönach / Große Laber
Schwebstoff vom 26.01.2020 bis zum 25.01.2021
| Datum | Konzentration [g/m³] | Abfluss [m³/s] |
|---|---|---|
| 25.01.2021 | 23,5 | 1,6 |
| 24.01.2021 | 28,6 | 1,75 |
| 23.01.2021 | 19,9 | 1,37 |
| 22.01.2021 | 18,3 | 1,24 |
| 21.01.2021 | 19,9 | 1,29 |
| 20.01.2021 | 18,7 | 1,2 |
| 19.01.2021 | 17,1 | 1,1 |
© Bayerisches Landesamt für Umwelt 2024