
- Startseite >
- Flüsse >
- Schwebstoff >
- Unterer Main >
- Schönach >
- Jahresgrafik

Jahresgrafik Schönach / Große Laber
Schwebstoff vom 01.01.2020 bis zum 31.12.2020
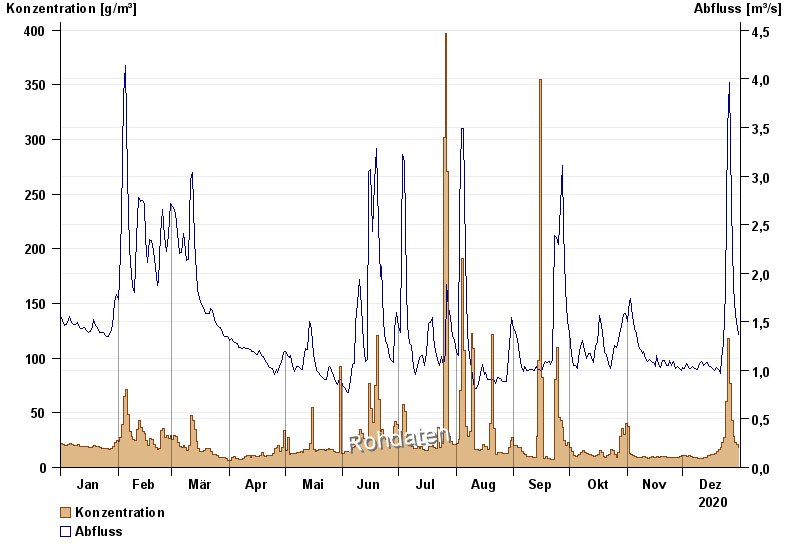
| Datum | Konzentration [g/m³] | Abfluss [m³/s] |
|---|---|---|
| 31.12.2020 | 18,5 | 1,37 |
| 30.12.2020 | 20,9 | 1,49 |
| 29.12.2020 | 22,9 | 1,69 |
| 28.12.2020 | 28,1 | 1,87 |
| 27.12.2020 | 43,4 | 2,69 |
| 26.12.2020 | 76,9 | 3,96 |
| 25.12.2020 | 117,7 | 3,48 |
© Bayerisches Landesamt für Umwelt 2024