
- Startseite >
- Flüsse >
- Schwebstoff >
- Unterer Main >
- Füssen >
- Jahresgrafik

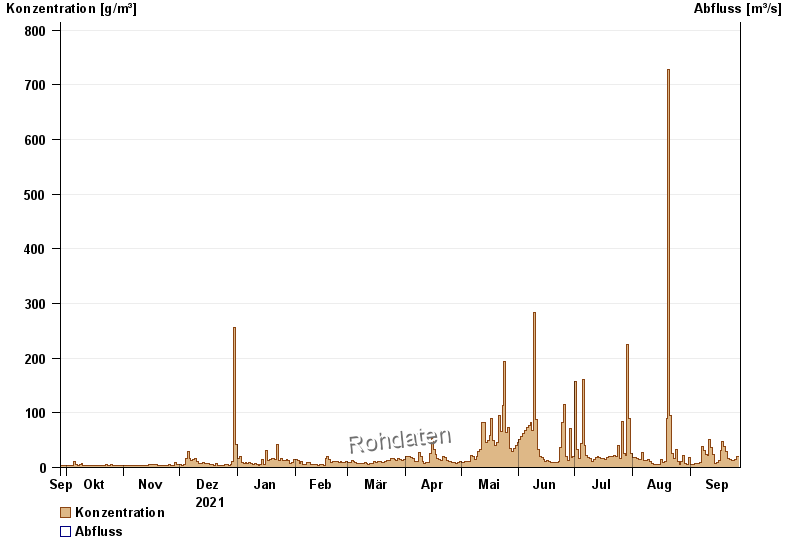
Jahresgrafik Füssen / Lech
Schwebstoff vom 28.09.2021 bis zum 27.09.2022
| Datum | Konzentration [g/m³] | Abfluss [m³/s] |
|---|---|---|
| 27.09.2022 | 20,0 | -- |
| 26.09.2022 | 20,0 | -- |
| 25.09.2022 | 14,2 | -- |
| 24.09.2022 | 12,5 | -- |
| 23.09.2022 | 13,1 | -- |
| 22.09.2022 | 14,9 | -- |
| 21.09.2022 | 17,2 | -- |
© Bayerisches Landesamt für Umwelt 2024