
- Startseite >
- Flüsse >
- Schwebstoff >
- Unterer Main >
- Füssen >
- Jahresgrafik

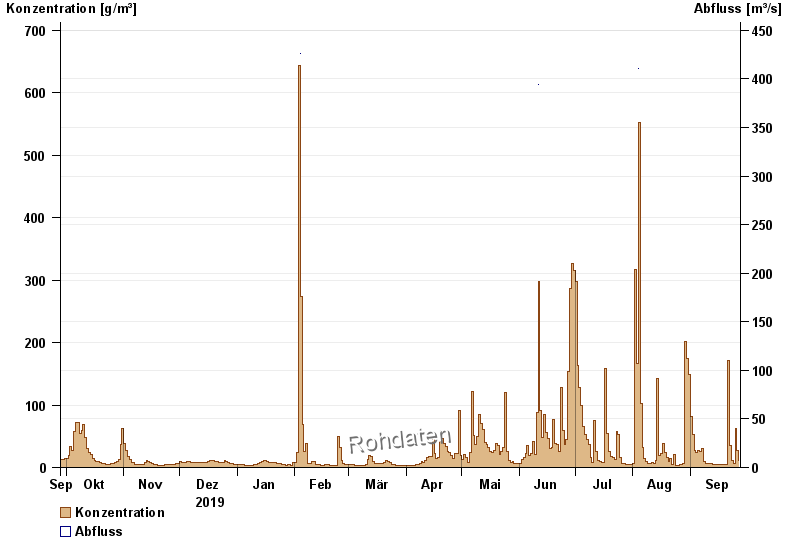
Jahresgrafik Füssen / Lech
Schwebstoff vom 28.09.2019 bis zum 27.09.2020
| Datum | Konzentration [g/m³] | Abfluss [m³/s] |
|---|---|---|
| 27.09.2020 | 11,3 | -- |
| 26.09.2020 | 26,5 | -- |
| 25.09.2020 | 62,4 | -- |
| 24.09.2020 | 5,9 | -- |
| 23.09.2020 | 10,9 | -- |
| 22.09.2020 | 35,2 | -- |
| 21.09.2020 | 171,9 | -- |
© Bayerisches Landesamt für Umwelt 2024