
- Startseite >
- Flüsse >
- Schwebstoff >
- Unterer Main >
- Füssen >
- Jahresgrafik

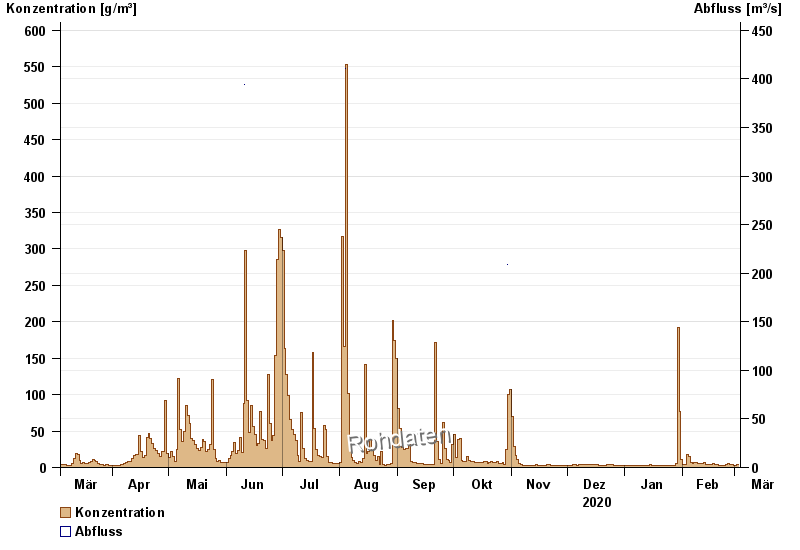
Jahresgrafik Füssen / Lech
Schwebstoff vom 04.03.2020 bis zum 03.03.2021
| Datum | Konzentration [g/m³] | Abfluss [m³/s] |
|---|---|---|
| 03.03.2021 | 3,8 | -- |
| 02.03.2021 | 3,8 | -- |
| 01.03.2021 | 3,4 | -- |
| 28.02.2021 | 3,2 | -- |
| 27.02.2021 | 3,8 | -- |
| 26.02.2021 | 4,4 | -- |
| 25.02.2021 | 5,2 | -- |
© Bayerisches Landesamt für Umwelt 2024