
- Startseite >
- Flüsse >
- Schwebstoff >
- Unterer Main >
- Donauwörth >
- Monatsgrafik

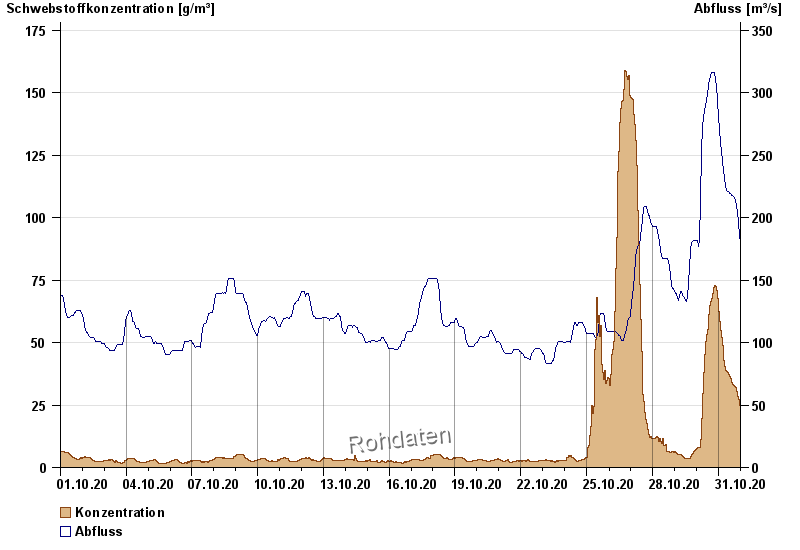
Monatsgrafik Donauwörth / Donau
Schwebstoff vom 01.10.2020 bis zum 31.10.2020
| Datum | Konzentration [g/m³] | Abfluss [m³/s] |
|---|---|---|
| 31.10.2020 23:45 | 23,8 | 178 |
| 31.10.2020 23:30 | 24,1 | 180 |
| 31.10.2020 23:15 | 24,3 | 180 |
| 31.10.2020 23:00 | 24,2 | 181 |
| 31.10.2020 22:45 | 24,5 | 184 |
| 31.10.2020 22:30 | 24,9 | 185 |
| 31.10.2020 22:15 | 25,2 | 187 |
© Bayerisches Landesamt für Umwelt 2024