
- Startseite >
- Flüsse >
- Schwebstoff >
- Unterer Main >
- Donauwörth >
- Jahresgrafik

Jahresgrafik Donauwörth / Donau
Schwebstoff vom 12.08.2021 bis zum 11.08.2022
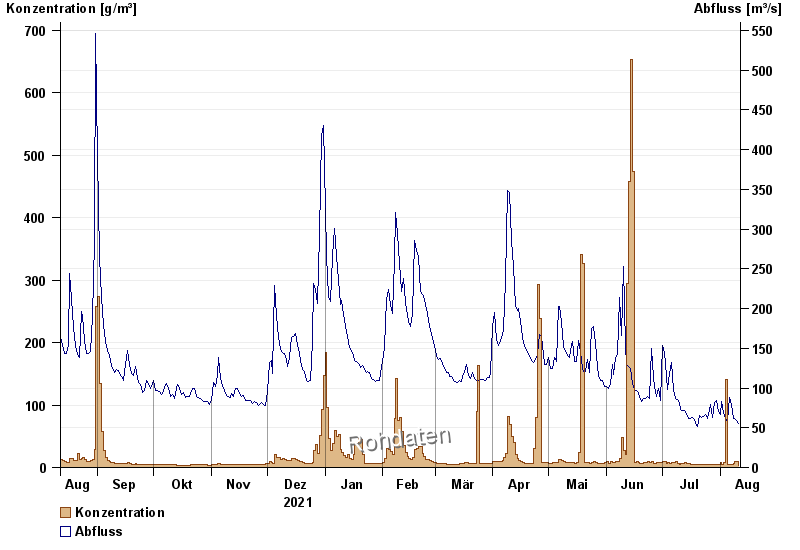
| Datum | Konzentration [g/m³] | Abfluss [m³/s] |
|---|---|---|
| 11.08.2022 | 3,9 | 55,1 |
| 10.08.2022 | 9,8 | 58,9 |
| 09.08.2022 | 10,3 | 61,9 |
| 08.08.2022 | 6,1 | 61,6 |
| 07.08.2022 | 5,0 | 79,1 |
| 06.08.2022 | 4,8 | 87,6 |
| 05.08.2022 | 5,0 | 58,3 |
© Bayerisches Landesamt für Umwelt 2024