
- Startseite >
- Flüsse >
- Schwebstoff >
- Unterer Main >
- Donauwörth >
- Jahresgrafik

Jahresgrafik Donauwörth / Donau
Schwebstoff vom 01.01.2018 bis zum 31.12.2018
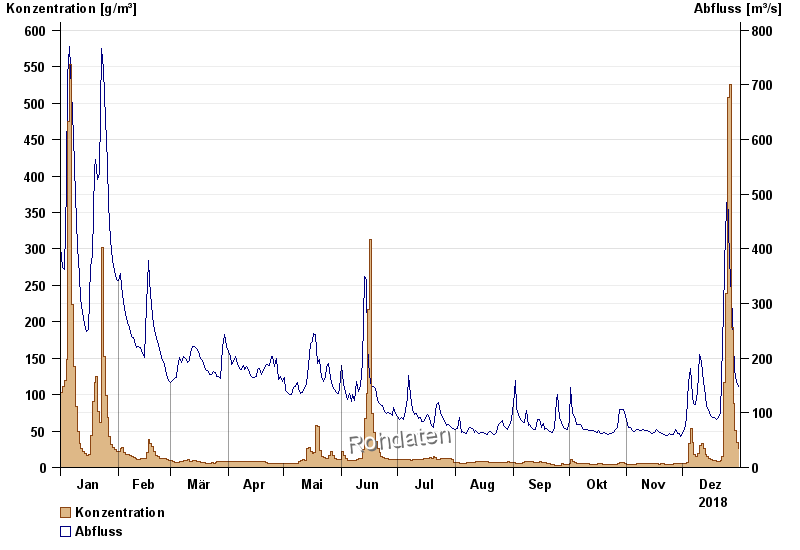
| Datum | Konzentration [g/m³] | Abfluss [m³/s] |
|---|---|---|
| 31.12.2018 | 25,8 | 148 |
| 30.12.2018 | 33,9 | 156 |
| 29.12.2018 | 51,0 | 178 |
| 28.12.2018 | 88,4 | 230 |
| 27.12.2018 | 191,6 | 312 |
| 26.12.2018 | 525,0 | 379 |
| 25.12.2018 | 507,7 | 503 |
© Bayerisches Landesamt für Umwelt 2024