
- Startseite >
- Flüsse >
- Schwebstoff >
- Unterer Main >
- Behringersmühle >
- Monatsgrafik

Monatsgrafik Behringersmühle / Wiesent
Schwebstoff vom 12.08.2020 bis zum 11.09.2020
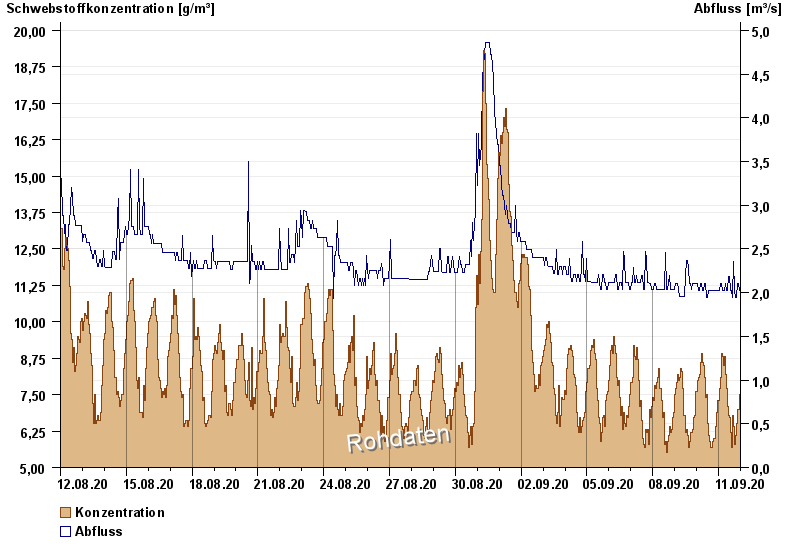
| Datum | Konzentration [g/m³] | Abfluss [m³/s] |
|---|---|---|
| 11.09.2020 23:45 | 8,0 | 2,02 |
| 11.09.2020 23:30 | 7,9 | 2,02 |
| 11.09.2020 23:15 | 7,8 | 2,02 |
| 11.09.2020 23:00 | 7,7 | 2,02 |
| 11.09.2020 22:45 | 7,2 | 2,02 |
| 11.09.2020 22:30 | 7,4 | 2,02 |
| 11.09.2020 22:15 | 7,5 | 2,02 |
© Bayerisches Landesamt für Umwelt 2024