
- Startseite >
- Flüsse >
- Schwebstoff >
- Obere Donau >
- Schönach >
- Jahresgrafik

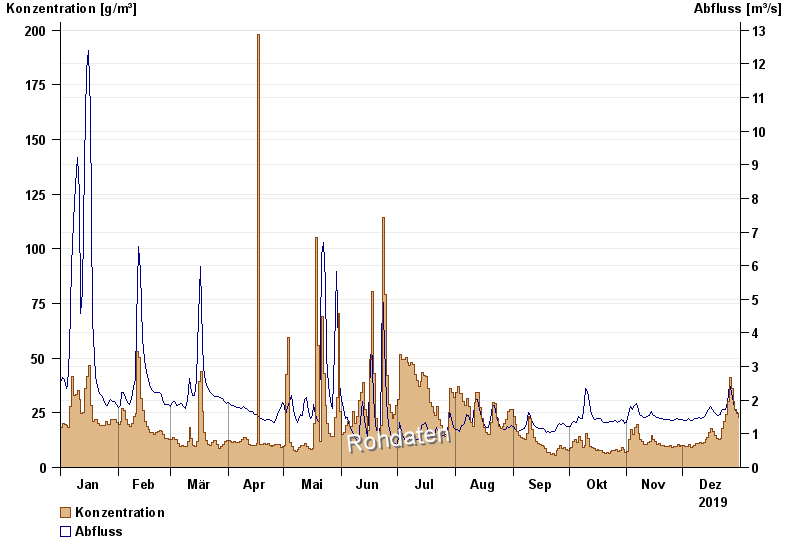
Jahresgrafik Schönach / Große Laber
Schwebstoff vom 01.01.2019 bis zum 31.12.2019
| Datum | Konzentration [g/m³] | Abfluss [m³/s] |
|---|---|---|
| 31.12.2019 | 22,9 | 1,58 |
| 30.12.2019 | 24,7 | 1,67 |
| 29.12.2019 | 26,7 | 1,76 |
| 28.12.2019 | 30,3 | 1,94 |
| 27.12.2019 | 36,3 | 2,24 |
| 26.12.2019 | 41,2 | 2,47 |
| 25.12.2019 | 30,1 | 1,92 |
© Bayerisches Landesamt für Umwelt 2024