
- Startseite >
- Flüsse >
- Schwebstoff >
- Obere Donau >
- Rosenheim o.d. Mangfallmündung >
- Jahresgrafik

Jahresgrafik Rosenheim o.d. Mangfallmündung / Inn
Schwebstoff vom 26.04.2024 bis zum 25.04.2025
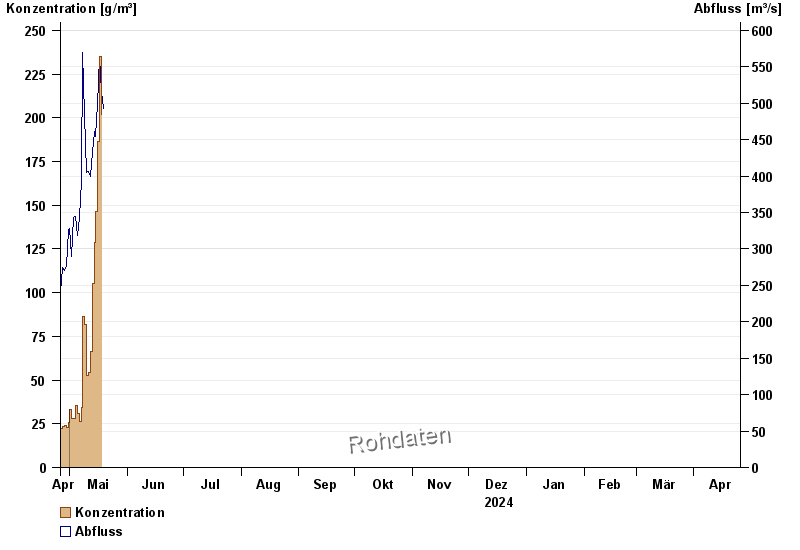
| Datum | Konzentration [g/m³] | Abfluss [m³/s] |
|---|---|---|
| 06.05.2024 | 26,2 | 343 |
| 05.05.2024 | 30,8 | 319 |
| 04.05.2024 | 35,4 | 344 |
| 03.05.2024 | 27,8 | 343 |
| 02.05.2024 | 28,1 | 290 |
| 01.05.2024 | 33,2 | 328 |
| 30.04.2024 | 25,6 | 326 |
© Bayerisches Landesamt für Umwelt 2024