
- Startseite >
- Flüsse >
- Schwebstoff >
- Obere Donau >
- Rosenheim o.d. Mangfallmündung >
- Jahresgrafik

Jahresgrafik Rosenheim o.d. Mangfallmündung / Inn
Schwebstoff vom 06.08.2020 bis zum 05.08.2021
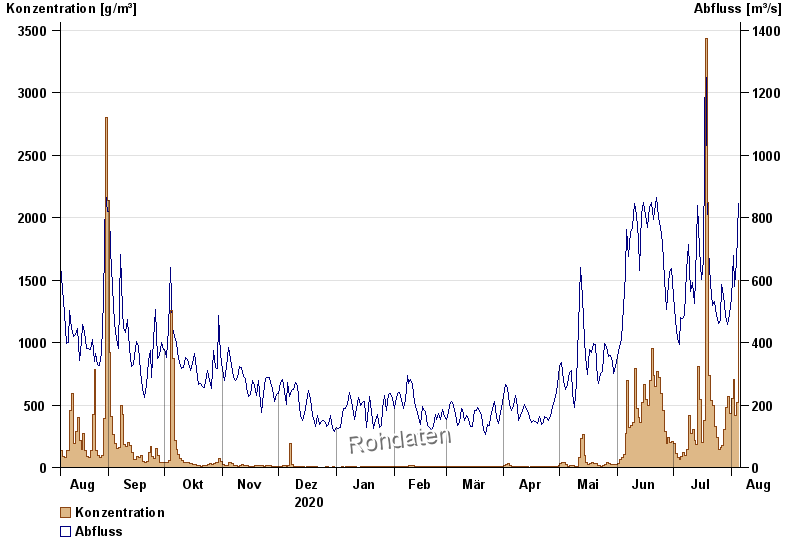
| Datum | Konzentration [g/m³] | Abfluss [m³/s] |
|---|---|---|
| 05.08.2021 | 1498,8 | 844 |
| 04.08.2021 | 520,2 | 656 |
| 03.08.2021 | 412,4 | 581 |
| 02.08.2021 | 706,7 | 678 |
| 01.08.2021 | 548,5 | 542 |
| 31.07.2021 | 434,4 | 490 |
| 30.07.2021 | 564,9 | 458 |
© Bayerisches Landesamt für Umwelt 2024