
- Startseite >
- Flüsse >
- Schwebstoff >
- Obere Donau >
- Plattling >
- Jahresgrafik

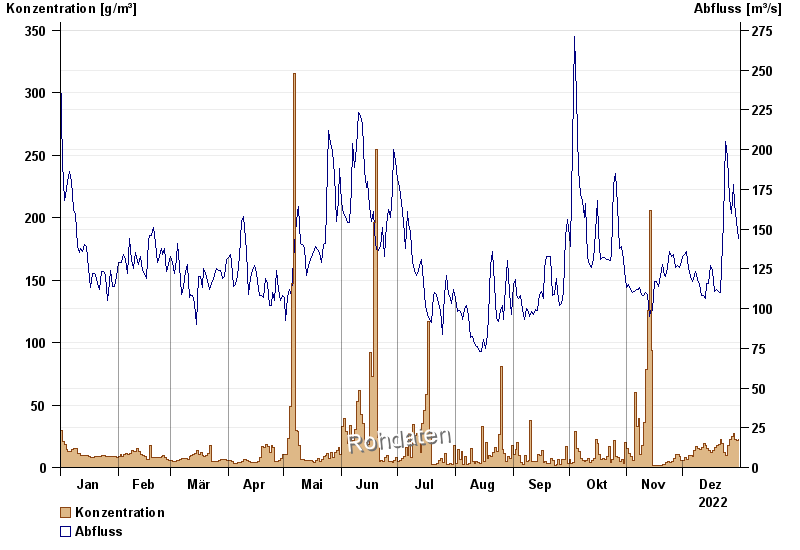
Jahresgrafik Plattling / Isar
Schwebstoff vom 01.01.2022 bis zum 31.12.2022
| Datum | Konzentration [g/m³] | Abfluss [m³/s] |
|---|---|---|
| 31.12.2022 | 22,4 | 144 |
| 30.12.2022 | 21,7 | 155 |
| 29.12.2022 | 22,8 | 166 |
| 28.12.2022 | 27,5 | 178 |
| 27.12.2022 | 25,0 | 160 |
| 26.12.2022 | 22,5 | 169 |
| 25.12.2022 | 17,5 | 195 |
© Bayerisches Landesamt für Umwelt 2024