
- Startseite >
- Flüsse >
- Schwebstoff >
- Obere Donau >
- Linden >
- Jahresgrafik

Jahresgrafik Linden / Rott
Schwebstoff vom 18.01.2020 bis zum 17.01.2021
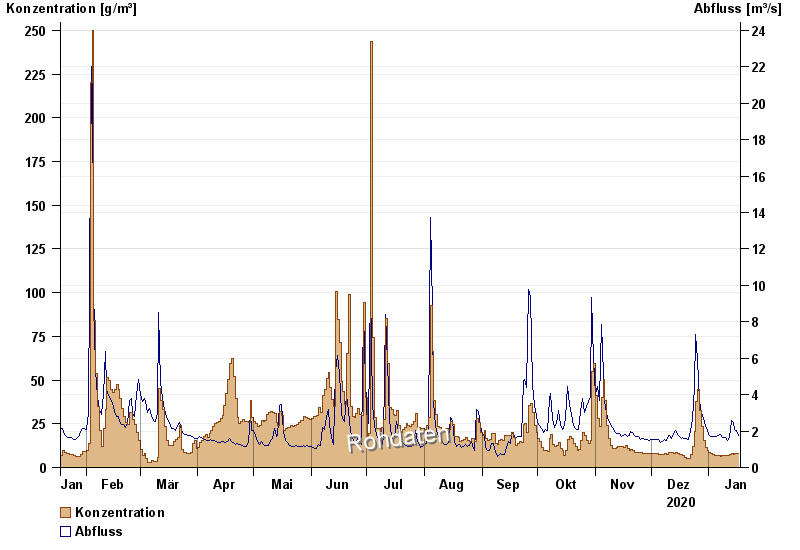
| Datum | Konzentration [g/m³] | Abfluss [m³/s] |
|---|---|---|
| 17.01.2021 | 7,9 | 1,74 |
| 16.01.2021 | 8,0 | 2,01 |
| 15.01.2021 | 7,9 | 2,08 |
| 14.01.2021 | 7,4 | 2,46 |
| 13.01.2021 | 7,8 | 2,6 |
| 12.01.2021 | 7,2 | 1,62 |
| 11.01.2021 | 7,1 | 1,48 |
© Bayerisches Landesamt für Umwelt 2024