
- Startseite >
- Flüsse >
- Schwebstoff >
- Obere Donau >
- Kienhof >
- Jahresgrafik

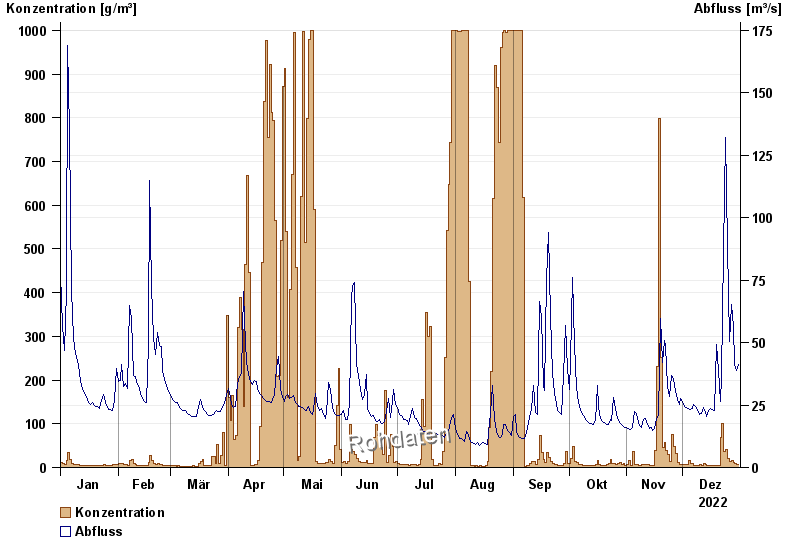
Jahresgrafik Kienhof / Regen
Schwebstoff vom 01.01.2022 bis zum 31.12.2022
| Datum | Konzentration [g/m³] | Abfluss [m³/s] |
|---|---|---|
| 31.12.2022 | 8,0 | 41,1 |
| 30.12.2022 | 7,8 | 38,8 |
| 29.12.2022 | 8,7 | 41,2 |
| 28.12.2022 | 11,1 | 56,3 |
| 27.12.2022 | 16,2 | 65,4 |
| 26.12.2022 | 14,1 | 50,3 |
| 25.12.2022 | 20,3 | 89,4 |
© Bayerisches Landesamt für Umwelt 2024