
- Startseite >
- Flüsse >
- Schwebstoff >
- Obere Donau >
- Kemmern >
- Jahresgrafik

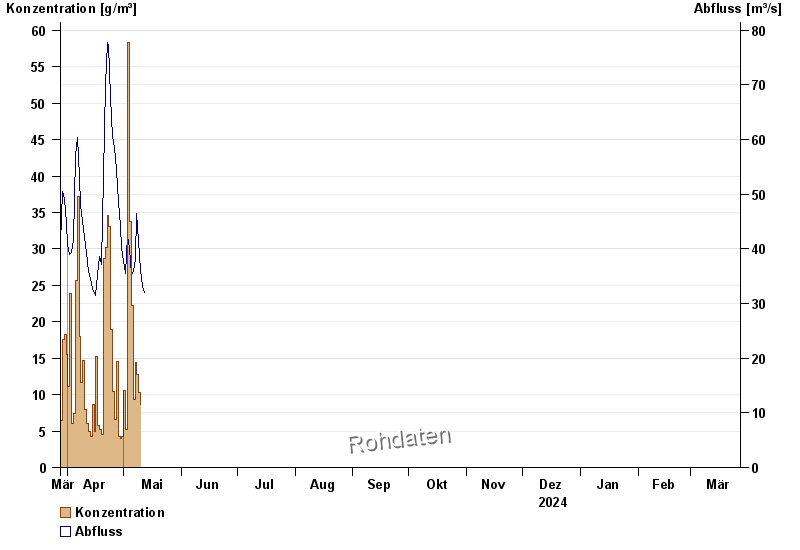
Jahresgrafik Kemmern / Main
Schwebstoff vom 28.03.2024 bis zum 27.03.2025
| Datum | Konzentration [g/m³] | Abfluss [m³/s] |
|---|---|---|
| 26.04.2024 | 6,6 | 58,5 |
| 25.04.2024 | 10,4 | 60,6 |
| 24.04.2024 | 18,9 | 67,7 |
| 23.04.2024 | 33,0 | 77,2 |
| 22.04.2024 | 34,6 | 77,7 |
| 21.04.2024 | 30,2 | 70 |
| 20.04.2024 | 28,6 | 53,5 |
© Bayerisches Landesamt für Umwelt 2024