
- Startseite >
- Flüsse >
- Schwebstoff >
- Obere Donau >
- Kemmern >
- Jahresgrafik

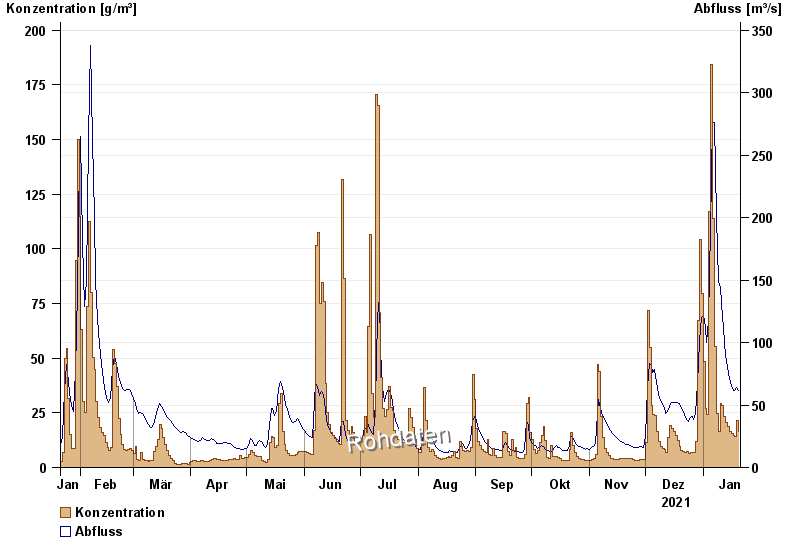
Jahresgrafik Kemmern / Main
Schwebstoff vom 21.01.2021 bis zum 20.01.2022
| Datum | Konzentration [g/m³] | Abfluss [m³/s] |
|---|---|---|
| 20.01.2022 | 16,5 | 61,5 |
| 19.01.2022 | 21,6 | 63,9 |
| 18.01.2022 | 14,0 | 61,4 |
| 17.01.2022 | 14,7 | 61,5 |
| 16.01.2022 | 15,3 | 65,7 |
| 15.01.2022 | 16,5 | 71,3 |
| 14.01.2022 | 18,5 | 80,1 |
© Bayerisches Landesamt für Umwelt 2024