
- Startseite >
- Flüsse >
- Schwebstoff >
- Obere Donau >
- Ingolstadt Luitpoldstraße >
- Jahresgrafik

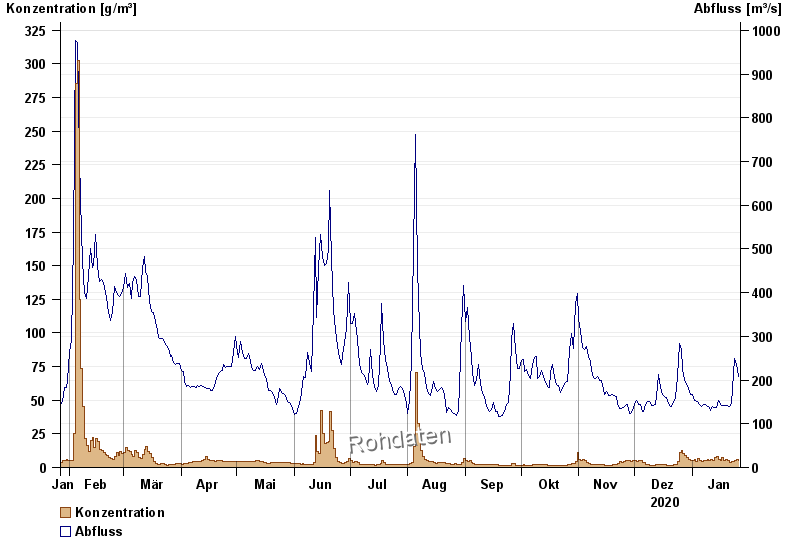
Jahresgrafik Ingolstadt Luitpoldstraße / Donau
Schwebstoff vom 27.01.2020 bis zum 26.01.2021
| Datum | Konzentration [g/m³] | Abfluss [m³/s] |
|---|---|---|
| 26.01.2021 | 4,9 | 209 |
| 25.01.2021 | 5,7 | 235 |
| 24.01.2021 | 4,9 | 249 |
| 23.01.2021 | 4,1 | 215 |
| 22.01.2021 | 4,7 | 147 |
| 21.01.2021 | 3,8 | 140 |
| 20.01.2021 | 5,1 | 142 |
© Bayerisches Landesamt für Umwelt 2024