
- Startseite >
- Flüsse >
- Schwebstoff >
- Obere Donau >
- Ingolstadt Luitpoldstraße >
- Jahresgrafik

Jahresgrafik Ingolstadt Luitpoldstraße / Donau
Schwebstoff vom 24.02.2021 bis zum 23.02.2022
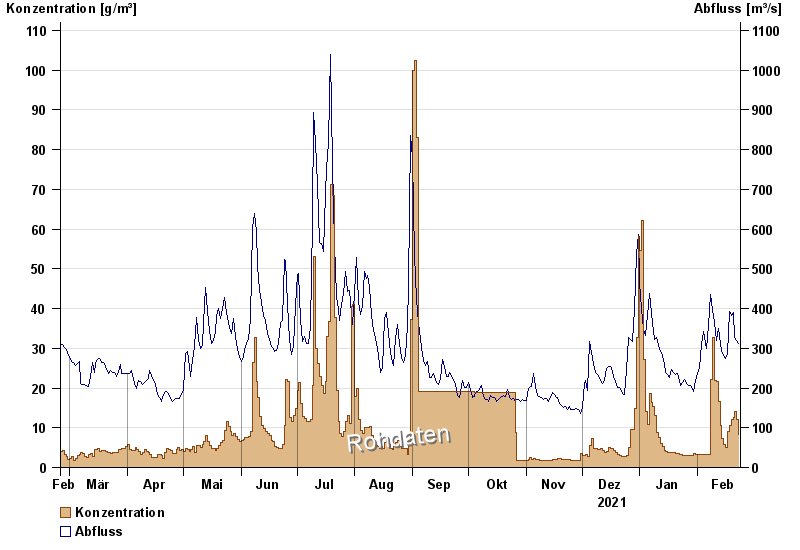
| Datum | Konzentration [g/m³] | Abfluss [m³/s] |
|---|---|---|
| 23.02.2022 | 8,3 | 312 |
| 22.02.2022 | 12,1 | 319 |
| 21.02.2022 | 14,1 | 327 |
| 20.02.2022 | 12,6 | 389 |
| 19.02.2022 | 12,1 | 382 |
| 18.02.2022 | 10,5 | 393 |
| 17.02.2022 | 9,1 | 286 |
© Bayerisches Landesamt für Umwelt 2024